
Figure 2.
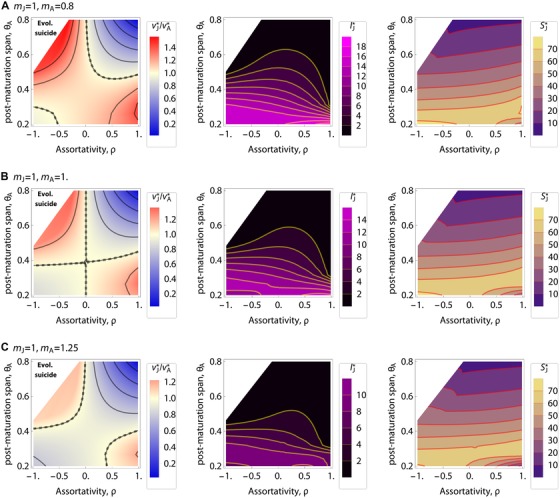
Left panels: Evolutionary outcomes of relative virulence , in which red color indicates and blue color indicates the opposite situation, . Color scales used are the same in the three panels. Middle panels: densities of infected juveniles at equilibrium, . Right panels: densities of susceptible juveniles at equilibrium, . In each panel, abscissa: assortativity; ordinate: post‐maturation span θA; from (A) to (C): as indicated; white zone: evolutionary suicide; dotted curve: (equal virulence); parameters: default values. Middle and right panel can clearly demonstrate that evolutionary suicide does occur in the white zone, as is very small but is not.