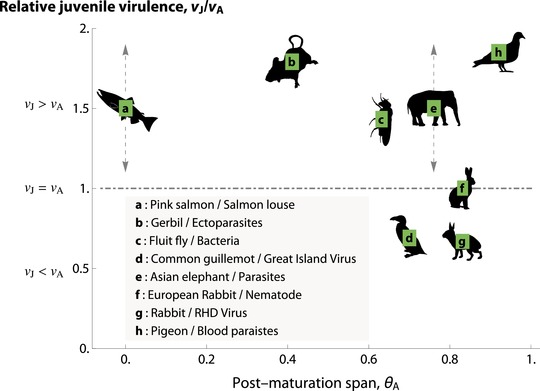
Figure 3.

A graphical representation of the empirical data on stage‐specific virulence. Each position of labels (from a to h, each within a green square) corresponds to a reported value of . In the following, H indicates “host” while P indicates “parasite(s)/pathogen(s)”. (a) H: pink salmon (Oncorhynchus gorbuscha); P: salmon louse (Heard 1991; Jones et al. 2008). (b) H: gerbil (Gerbillus andersoni); P: ectoparasites, including fleas (Synosternus cleopatrae), mites (Androlaelaps centrocarpus, A. insculptus, A. hirsti, A. marshalli, and A. androgynus), and ticks (Hyalomma impeltatum) (Wassif & Soliman 1980; Delany 1986; Hawlena et al. 2006). (c) H: fluit fly (Drosophila melanogaster) P: bacteria (Pseudomonas entomophila; Luckinbill et al. 1984; Vodovar et al. 2005); (d) H: common guillemot (Uria aalge); P: Great Island Virus (Harris & Wanless 1995; Nunn et al. 2006; Wanelik et al. 2017). (e) H: Asian elephant (Elephas maximus); P: parasites (Sukumar et al. 1997; Lynsdale et al. 2017). (f) H: European rabbit (Oryctolagus cuniculus); P: nematode (von Holst et al. 2002; Cornell et al. 2008). (g) H: rabbits (Leporidae); P: RHD virus (Morisse et al. 1991; Reluga et al. 2007). (h) H: pigeon (Columba livia); P: blood parasites (Lack 1968; Holmes & Ottinger 2003; Sol et al. 2003). For (a) and (e), we were able to find qualitative data (), but not quantitative ones. As such, we placed them at the height of 1.5 (>1), and indicated variations by dashed, gray arrows thereon. Data behind this figure are shown in SI Table in Appendix D. Animal drawings are from phylopic.org, with full credit in Appendix D.
