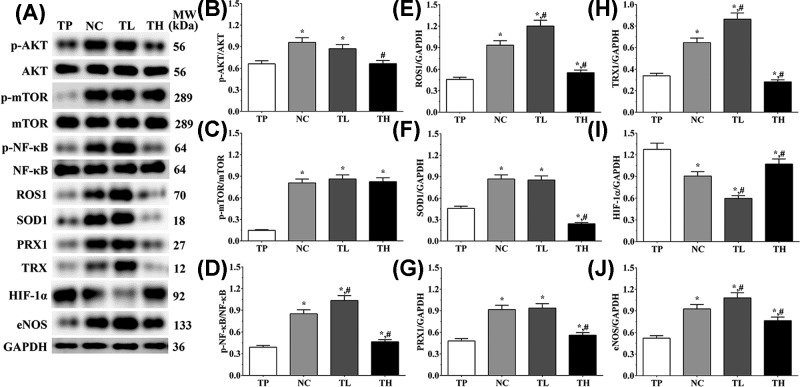
Figure 4. Effect of THP and rutin on activation of PI3K/AKT/mTOR signaling pathway and expression of antioxidative stress enzymes in H9c2 cells.
(A) Western blotting analysis on expression of p-AKT, AKT, p-mTOR, mTOR, p-NF-κB p65, NF-κB, eNOS, ROS1, SOD1 PRX1, TRX, and HIF-1α. (B) Quantitative analysis of ratio of p-AKT/AKT. (C) Quantitative analysis of ratio of p-mTOR/mTOR. (D) Quantitative analysis of ratio of p-NF-κB p65/NF-κB. (E) Quantitative analysis on expression of ROS1. (F) Quantitative analysis on expression of SOD1. (G) Quantitative analysis on expression of PRX1. (H) Quantitative analysis on expression of TRX1. (I) Quantitative analysis on expression of HIF-1α. (J) Quantitative analysis on expression of eNOS. GAPDH was used as an internal control. Data were presented as mean ± S.E.M. Each experiment was repeated for three times independently. *: P<0.05 vs. TP group. #: P<0.05 vs. control group.

