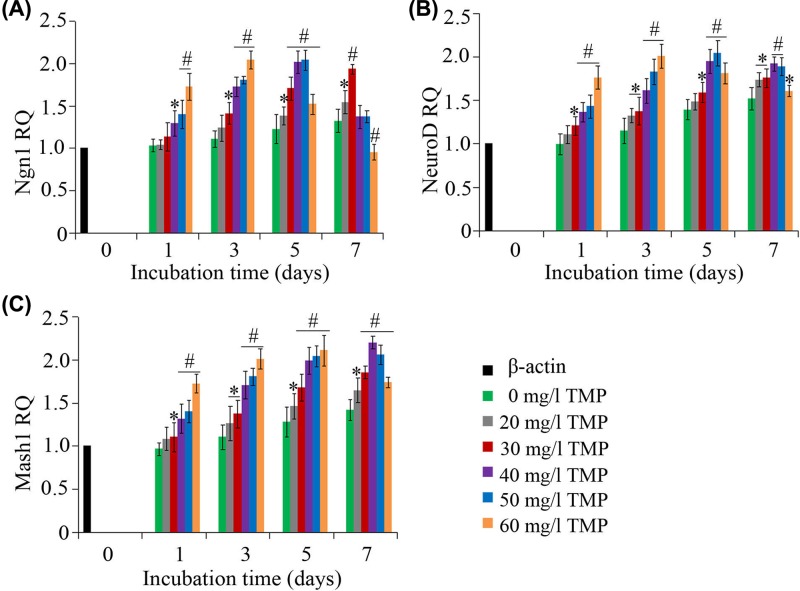
Figure 7. qRT-PCR detection of the change patterns in the expression of bHLH TFs.
(A) The RQ of Ngn1 in different groups at days 1, 3, 5, and 7 after neural induction. (B) The RQ of NeuroD in different groups at days 1, 3, 5, and 7 after neural induction. (C) The RQ of Mash1 in different groups at days 1, 3, 5, and 7 after neural induction. β-actin served as an endogenous control gene. *P<0.05 vs. control; #P<0.05 vs. control.

