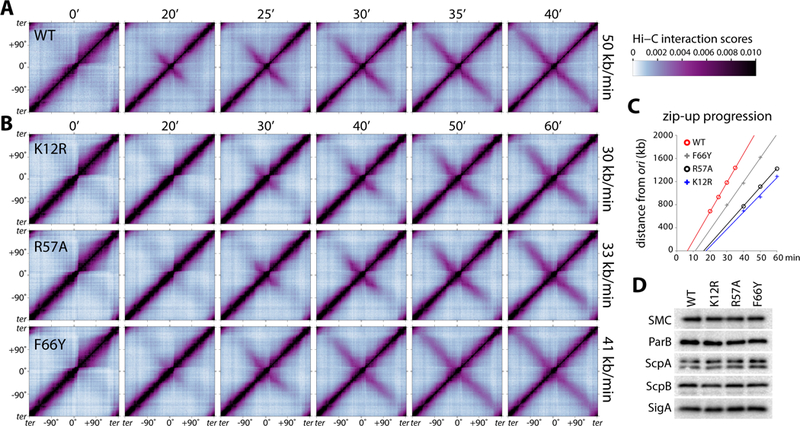
Figure 2. SMC ATPase mutants have reduced rates of DNA juxtaposition.

A, Normalized Hi-C interaction maps displaying contact frequencies for pairs of 10 kb bins. The strain (BWX4077) contains wild-type smc, a single parS site at −1˚ and an IPTG-inducible parB allele. Maps show interaction frequencies before and after addition of IPTG. Time after induction is indicated above the maps. Axes present genome positions in degrees and are oriented with the replication origin at the center. The rate of DNA juxtaposition is indicated on the right. See Figure S3 for analysis. The scale bar depicts Hi-C interaction scores for all contact maps presented in this study. B, Hi-C time course of strains containing smc point mutations, K12R (BWX4149), R57A (BWX4078) and F66Y (BWX4152). C, Extent of juxtaposition over time averaged for the left and right arms in the indicated strains. Extrapolation to the abscissa shows the relative lag before juxtaposition begins. See Figure S3 for details. D, Immunoblot analysis of the same strains presented in A and B in the presence of IPTG. The levels of SMC variants, ScpA, ScpB and ParB are similar in all four strains. For the ScpA blot, the bottom band is ScpA and the top band is non-specific. SigA controls for loading. See also Figures S3, S4, S5 and Table S1.
