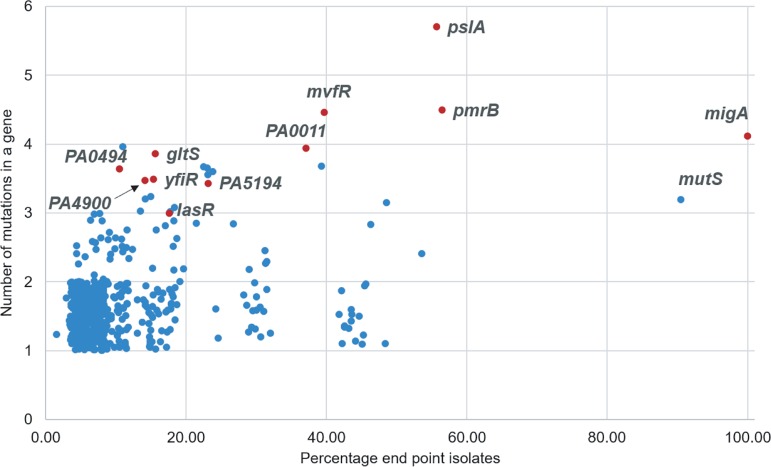
FIG 4.
Genes mutated more frequently than expected identified using Fisher’s exact test. The number of mutations identified within a single gene among the 29 sequenced endpoint isolates was plotted against the percentage of endpoint isolates containing a mutation in that gene. Genes identified as significant with a P value less than 0.001 in Fisher’s exact test are highlighted in red. False noise has been added to the data points to separate them on the graph. A detailed analysis of this graph is provided in File S1.

