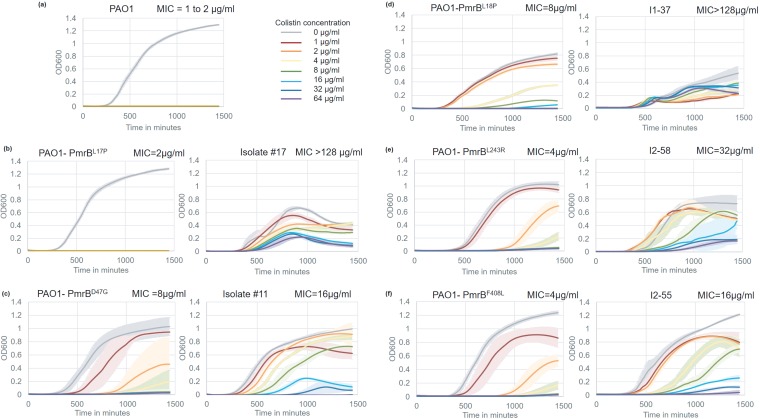
FIG 6.
Growth characteristics of PAO1 ancestor, constructed point mutants, and bioreactor-adapted endpoint isolates. Each panel (except panel a) represents the constructed mutant on the left and the bioreactor-adapted endpoint isolate carrying the same pmrB mutation on the right. All growth assays were conducted at colistin concentrations ranging from 0 to 64 μg/ml. Error bars represent the standard deviation of the results from three biological replicates. The MICs of all these strains, measured by broth microdilution, are on the top-right corner of each graph.

