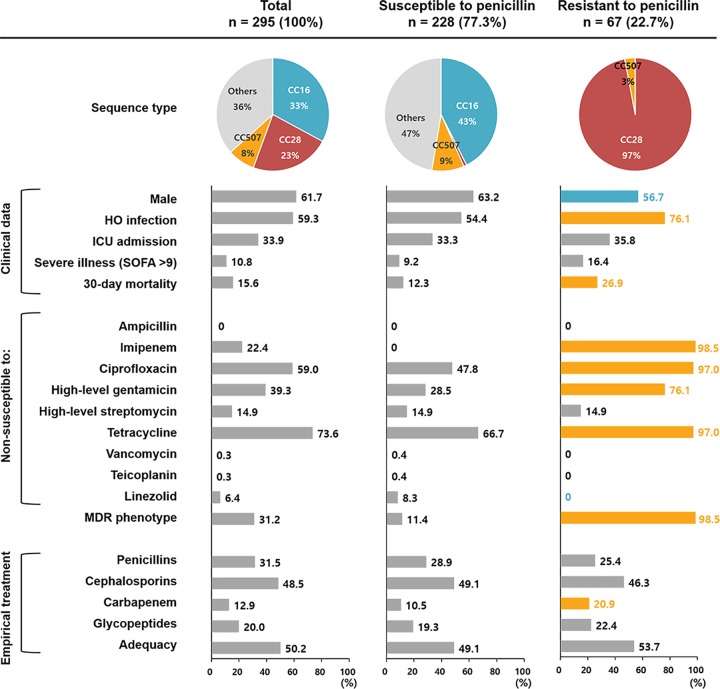
FIG 1.
Comparison of characteristics of patients with E. faecalis BSIs and their causative pathogens stratified according to penicillin susceptibility. The pie charts indicate the proportions of major sequence types, and the proportions of each variable are indicated in the bar charts. Statistical significance (P < 0.05), assessed using the chi-square test, is presented for the penicillin-resistant group with colored bars and numbers (orange, more prevalent; blue, less prevalent).

