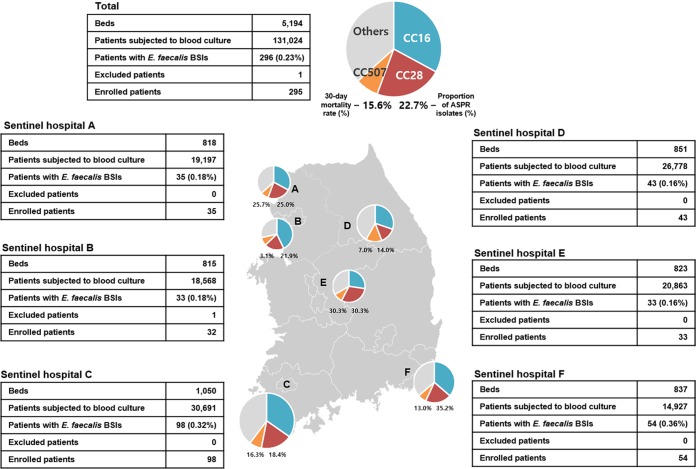
FIG 4.
Geographic distribution of sentinel hospitals (hospitals A to F) in the Korean peninsula. The numbers of beds and E. faecalis bloodstream infection cases in each hospital are indicated in the tables. The pie charts indicate the proportions of major sequence types of causative E. faecalis strains, and the percentages below the pie charts indicate the 30-day mortality rates for patients with E. faecalis BSIs and the proportions of ASPR strains. The relative sizes of the pie charts indicate the number of E. faecalis cases in each hospital.

