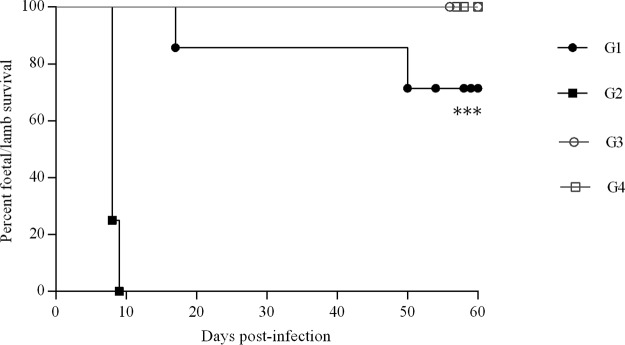
FIG 3.
Kaplan-Meier survival curves for fetuses in the infected groups (G1 and G2) and uninfected groups (G3 and G4). In infected groups, G1 received BKI-1294 treatment and G2 did not. In uninfected groups, G3 was dosed with BKI-1294 while G4 received vehicle alone. Each point represents the percentage of surviving animals on that day, and downward steps correspond to observed deaths. Fetal survival curves were compared by the log-rank (Mantel-Cox) test. For significant differences between fetal survival curves of infected groups, P < 0.001 (***).

