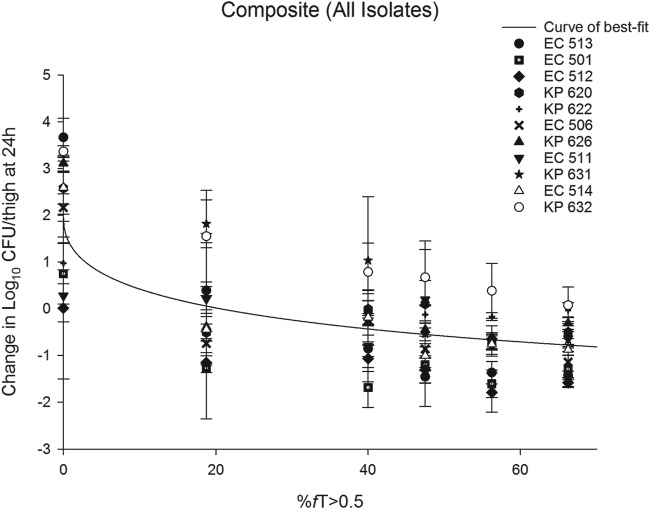
FIG 4.
Curve of best fit to %fT>0.5 mg/liter and the change in log10 CFU per thigh at 24 h for the composite of all isolates tested in the neutropenic thigh infection model. The solid line represents the curve of best fit, while the symbols represent the actual changes in bacterial burdens observed in mice. Data are means ± standard deviations.

