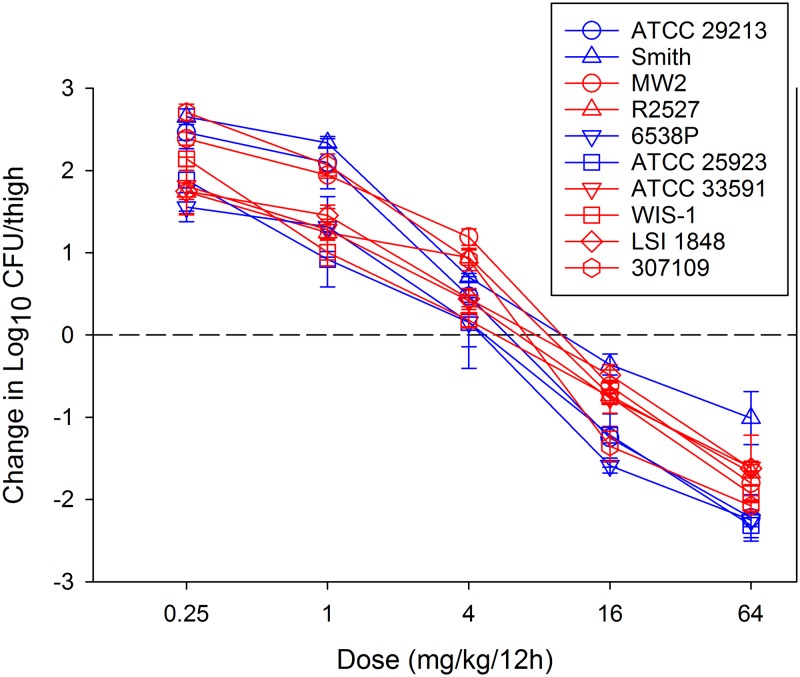
FIG 1.
Dose-response curves for omadacycline against 10 S. aureus (blue symbols, MSSA; red symbols, MRSA) strains in the neutropenic murine thigh infection model. Each symbol represents the mean and standard deviation from four thigh infection replicates. Five different dose levels were administered by subcutaneous route every 12 h. The burden of organisms was enumerated at the start and end of therapy over a 24-h experiment duration. The horizontal dashed line at 0 represents the burden of organisms at the start of therapy. Data points above the line represent a net growth (i.e., increase) in burden, and those below the line represent net cidal activity (i.e., decrease) in bacterial burden.

