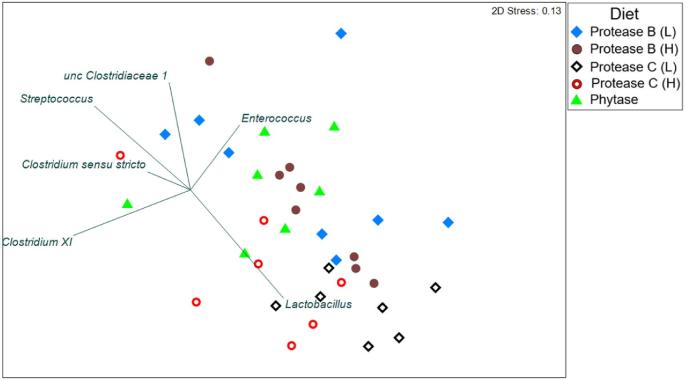
Figure 1.
Non-metric multi-dimensional scaling plot illustrating the global bacterial community structure of dietary treatments that showed a statistical difference among each other (low (L) and high (H) supplementation levels of protease). The symbols represent one pooled sample from each pen comprising all Operational Taxonomic Units clustered at genus level.

