Figure 1.

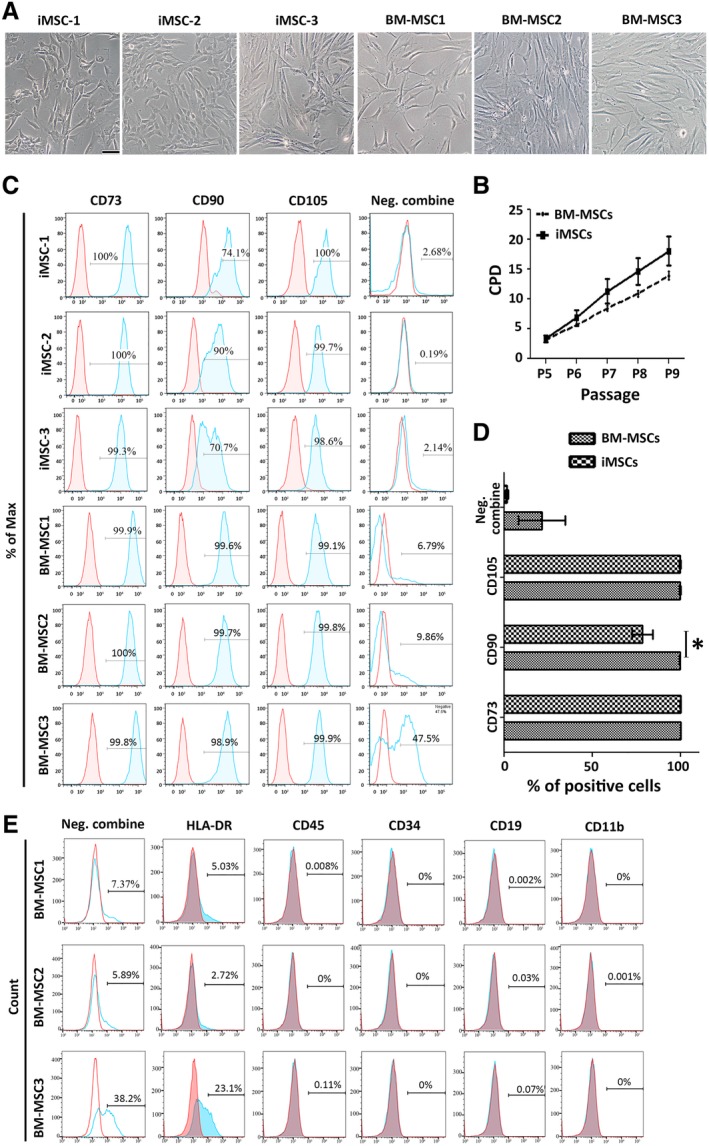
Preliminary characterization of induced mesenchymal stromal cells (iMSCs) and bone marrow (BM) derived‐MSCs. (A): Cellular morphology. Scale bar = 50 μm. (B): Proliferation capacity of each cell group compared based on the cumulative population doublings (CPD) (mean ± SEM). See Supporting Information Figure S2 for the growth rate of each line. (C–E): Surface profile analysis of the cells (P5) using flow cytometry. Red histograms represent isotype controls with the blue overlays representing each antigen; percentages of positive cells are shown within histograms. (C): Positive markers included CD90/73/105. The negative (Neg.) combine is a mixed antibody pool assessing CD45, CD34, CD19, CD11b, or HLA‐DR positive cells. (D): Summary of the immunophenotype of BM‐MSC and iMSC lines as detected by flow cytometry. Data represent mean ± SEM of n = 3; *, p < .05. (E): Individual antibody staining of hematopoietic populations to identify the positive signal shown in the Neg. combine group. See also Supporting Information Figure S3.
