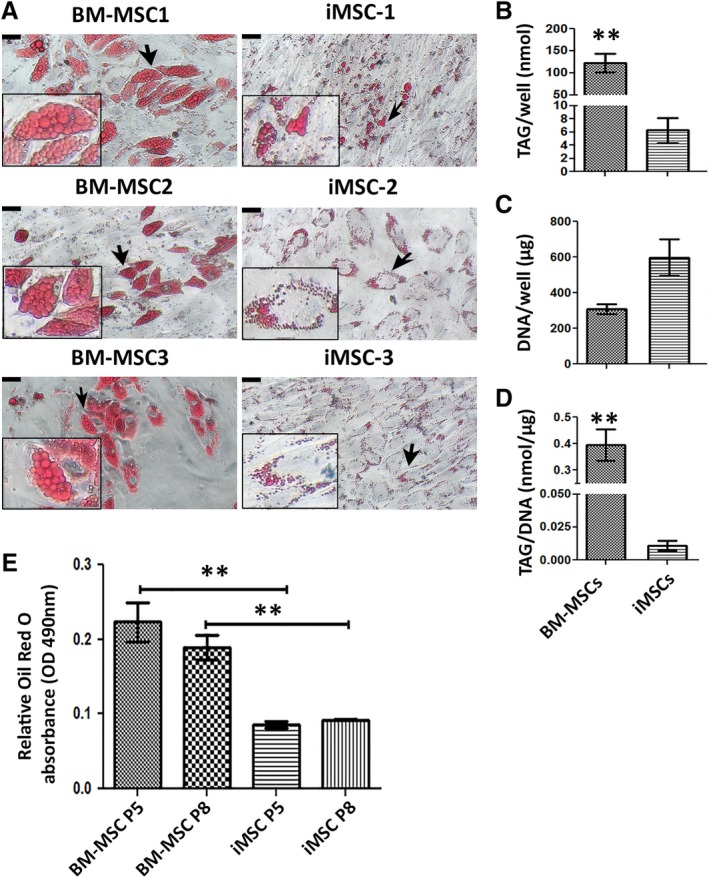
Figure 2.

Adipogenic capacity of induced mesenchymal stromal cells (iMSCs) and bone marrow (BM) derived‐MSCs. (A): Morphologies of formed lipid droplets shown by staining with Oil Red O solution. Representative images of each cell line (P5) are shown. Insets are magnified images of the areas indicated by black arrows. Scale bar = 22.7 μm. (B–D): The amount of TAG and DNA and the ratio of TAG per DNA between the BM‐MSCs and iMSCs groups are shown. Data in each bar chart represents mean ± SEM of n = 3; **, p < .01. (E): Quantification of lipid elaborated by extraction of Oil Red O stain and measuring absorbance at O.D. 490 nm, n = 3 wells for each group. Results are mean ± SEM; **, p < .01.
