Figure 3.

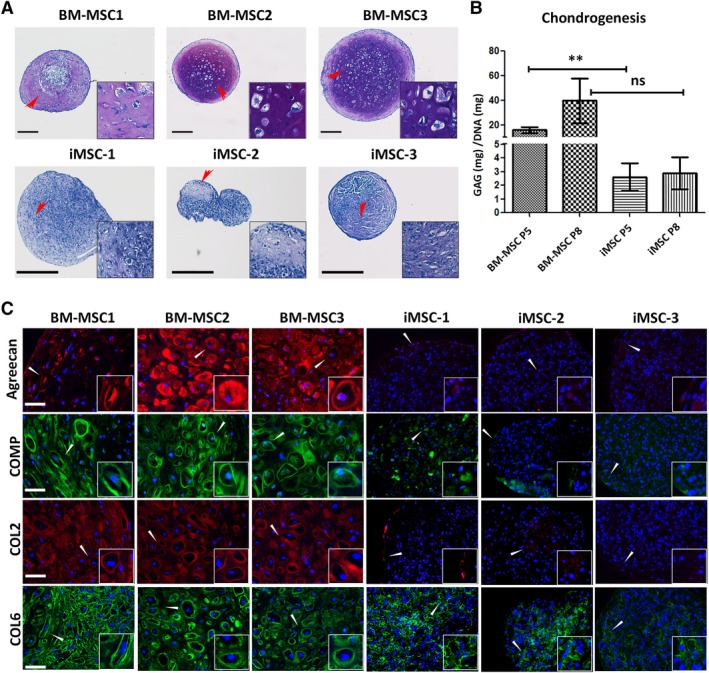
Comparison of chondrogenic pellets derived from induced mesenchymal stromal cells (iMSCs) and bone marrow (BM) derived‐MSCs. (A): Representative images of toluidine blue stained sections demonstrate the presence of GAG within the chondrogenic matrix of the pellets derived from MSCs at P5. Scale bar = 250 μm. (B): GAG quantification relative to DNA content of tested pellets. Data represents mean ± SEM of n = 3; **, p < .01. (C): Representative images of immunofluorescent staining for cartilaginous matrix components (aggrecan [red], COMP [green], COL2 [red], and COL6 [green]) on the pellets differentiated from P5 MSCs. Cell nuclei were stained with DAPI (blue). Scale bar = 50 μm. Insets displayed in (A) and (C) are magnified images of the areas indicated by the arrowheads.
