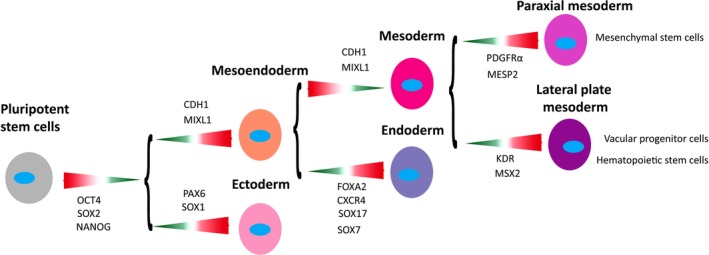
Figure 7.

Schematic roadmap of lineage ontogenesis from pluripotent stem cells to different mesenchymal progenitors. Key genes associated with each developmental stage are shown. Lineage choice‐associated expression patterns are indicated by the colored arrows, where green with narrow end represents downregulation and red with open end upregulation.
