Figure 3:
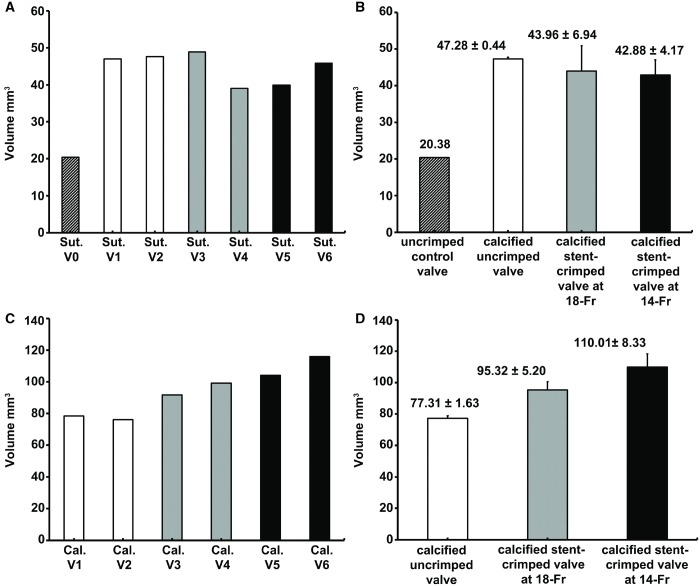
Quantification of calcified regions using microcomputed tomographic scanning. (A) Total suture volume was quantified for each valve. (B) The quantified suture volume for each group is shown as the mean ± standard deviation. (C) Total calcification volume is quantified for each valve. (D) The quantified calcification volume for each group is shown as mean ± standard deviation. Cal: calcification; Sut: suture; V0: (valve 0) uncrimped control; V1: (valve 1) calcified uncrimped; V2: (valve 2) calcified uncrimped; V3: (valve 3) calcified crimped valve at 18-Fr; V4: (valve 4) calcified crimped valve at 18-Fr; V5: (valve 5) calcified crimped valve at 14-Fr; V6: (valve 6) calcified crimped valve at 14-Fr.

