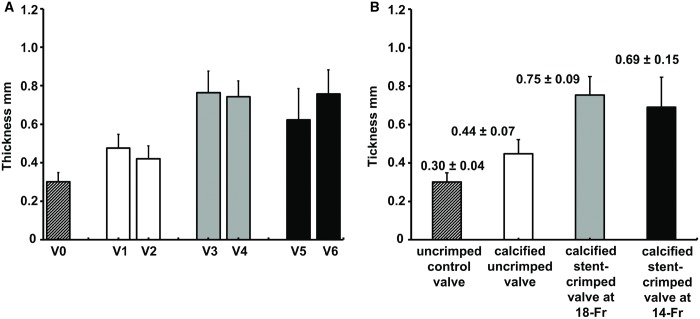
Figure 5:
Valve thickness measurement using microcomputed tomographic scanning. (A) The measured thickness of the leaflets for each studied valve. (B) The measured thicknesses of the leaflets for each studied group. The measured thicknesses of the leaflets are shown as the mean ± standard deviation. V0: (valve 0) uncrimped control; V1: (valve 1) calcified uncrimped; V2: (valve 2) calcified uncrimped; V3: (valve 3) calcified stent-crimped valve at 18-Fr; V4: (valve 4) calcified stent-crimped valve at 18-Fr; V5: (valve 5) calcified stent-crimped valve at 14-Fr; V6: (valve 6) calcified stent-crimped valve at 14-Fr.

