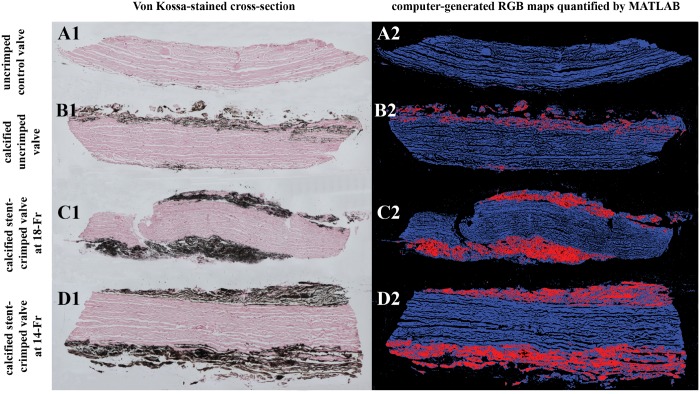
Figure 6:
Von Kossa staining for quantifying calcification. The panels compare Von Kossa staining of representative samples of 4 different studied valve groups along with their computer-generated RGB map: a sample from the uncrimped control valve (A1–2); from a calcified uncrimped valve (B1–2); from a calcified stent-crimped valve at 18-Fr (C1–2); and from a calcified stent-crimped valve at 14-Fr (D1–2). A1, B1, C1 and D1 are Von Kossa-stained cross-sections of 4 different valves. Black regions demonstrate the calcification. A2, B2, C2 and D2 are computer-generated RGB maps quantified by an in-house MATLAB routine. Blue and red represent uncalcified and calcified regions, respectively. RGB: red, green and blue.

