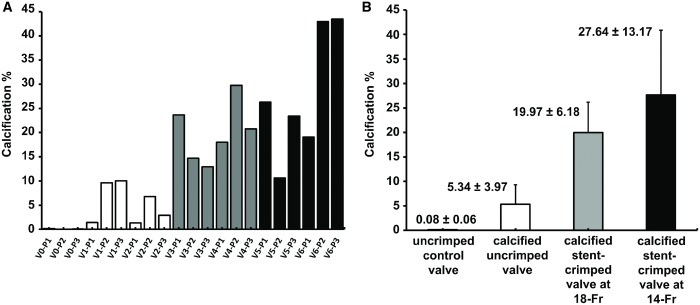
Figure 7:
Quantification of calcified regions using histopathological analysis. (A) Total calcification ratio in terms of percentage quantified for each valve’s post according to the computer analyses of the Von Kossa staining. (B) The average calcification in terms of percentage for all the valves’ posts in each studied group is shown as mean ± standard deviation. V0: (valve 0) uncrimped control; V1: (valve 1) calcified uncrimped; V2: (valve 2) calcified uncrimped; V3: (valve 3) calcified stent-crimped valve at 18-Fr; V4: (valve 4) calcified stent-crimped valve at 18-Fr; V5: (valve 5) calcified stent-crimped valve at 14-Fr; V6: (valve 6) calcified stent-crimped valve at 14-Fr; P1, P2 and P3 denote valve posts 1, 2 and 3, respectively. Three punch biopsies were taken from each valve, adjacent to the valve’s post.

