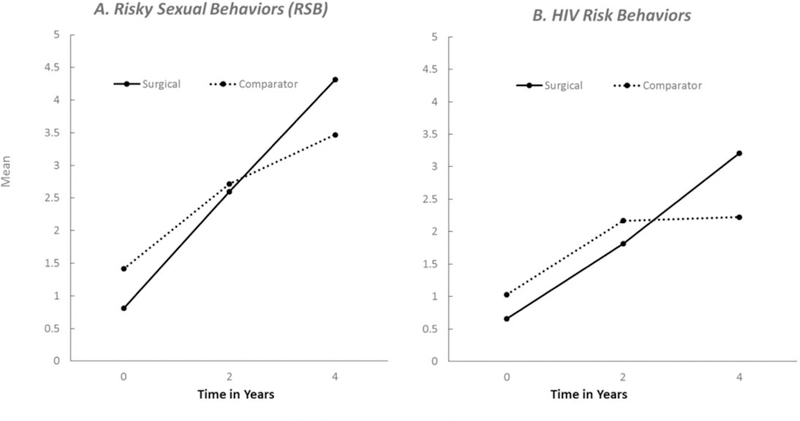
Figure 2.

Observed means are plotted for surgical females and comparator females. A. For RSB, longitudinal analyses within a structural equation modeling framework indicated a non-significant group by time interaction (surgical: y = 0.12x-2.94; comparator: y = −0.16x-2.12; p=0.11) and group difference for the intercept (p = 0.18) B. For HIV Risk Behaviors, analyses indicated a significant linear slope for the group by time interaction (surgical: y=0.86x-2.41; comparator: y=0.58x-1.80; p=0.03) and a marginally significant group difference for the intercept (p=0.05). Age, race, and baseline BMI were controlled in both analyses.
