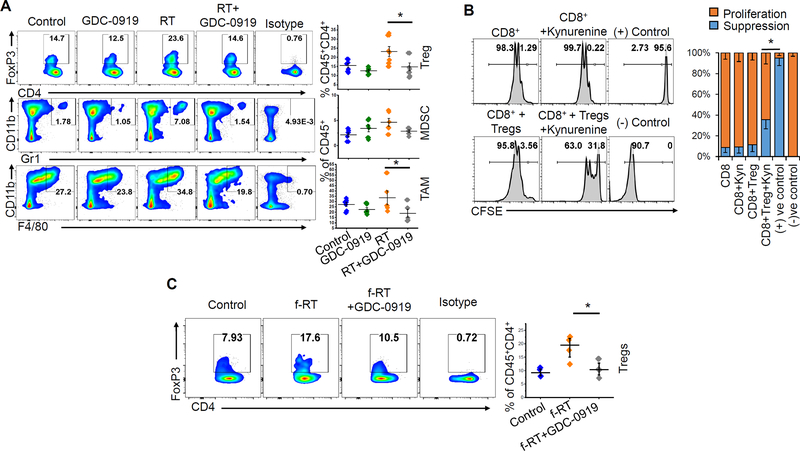
Figure 5. Tryptophan metabolism contributes to radiation-induced immune suppression in glioblastoma.
(A) Intracranial tumors were macrodissected from mice 5 days following the GDC-0919 and/or RT treatment schedule described in Fig. 4B and analyzed for immune correlates by flow cytometry, including presence of regulatory T cells (Tregs; CD4+FoxP3+CD25+), myeloid-derived suppressor cells (CD45+CD11b+Gr1+) and tumor-associated macrophages (CD45+CD11b+F4/80+). Scatter plot represents data from 5–6 tumors from each group. (B) To analyze the suppressive ability of Tregs, splenocytes from C57BL/6 mice were used for isolating CD8+ T cells and Tregs (CD4+CD25+) using magnetic sorting. CFSE labeled CD8+ T cells were activated using plate-bound anti-CD3/CD28 antibody for three days in presence or absence of Tregs (CD8:Tregs=1:3) and kynurenine (50μM) and represented as flow histogram plots as CFSE dilution (proliferation) or no proliferation (suppression). The bar graph represents cumulative data from three experiments. (C) Intracranial tumors were macrodissected from mice 7 days following the GDC-0919 and/or fractionated RT treatment schedule described in Fig. 4C and analyzed for immune correlates by flow cytometry, including presence of Tregs (CD4+FoxP3+CD25+). Scatter plot represents data as mean ± SEM from 4 tumors in each group. *= p<0.05

