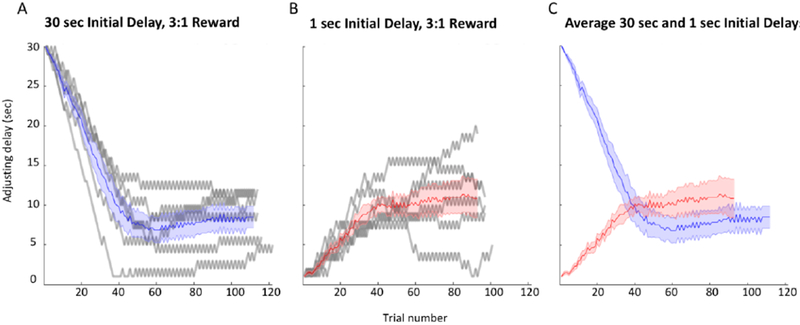
Figure 2.

(A) Adjusting delay duration is plotted against trial number for a single control session (30-second initial delay) for each of the 7 rats in the experiment (gray curves). The blue curve represents the mean delay plus SEM. (B) Another control session for each of the 7 rats at a 1-second initial delay is shown (gray curves). The red curve represents the mean delay plus SEM. (C) The mean plus SEM curves for the sample control sessions provide a comparison of performance at the 30-second and 1-second initial delays.
