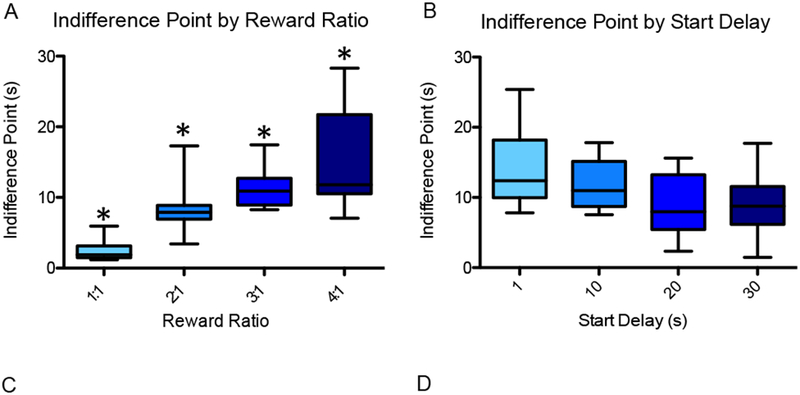
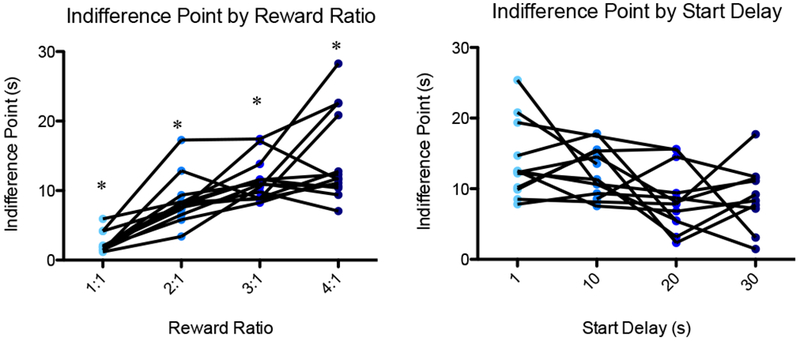
Figure 4.


To test baseline temporal discounting behavior, 13 rats (including the 7 used for experimental testing) each completed 16 sessions combining one of four reward ratios (1:1, 2:1, 3:1, 4:1) with one of four initial delays (30, 20, 10, 1 sec). (A) Indifference point (mean adjusting delay duration of the final 20 trials of the session) is plotted as a function of reward ratio. There was a significant main effect of reward ratio on indifference point, and for the 2:1, 3:1, and 4:1 reward ratios, the indifference point was significantly higher than that for the reward ratio below. (B) Indifference point is plotted as a function of start delay for the 3:1 reward condition. The effect of start delay on indifference point was insignificant. An asterisk represents a statistically significant difference from the other conditions. Boxes represent the interquartile range; lines in the boxes and error bars represent the median and minimum/maximum values. (C and D) Points represent individual rats across conditions.
