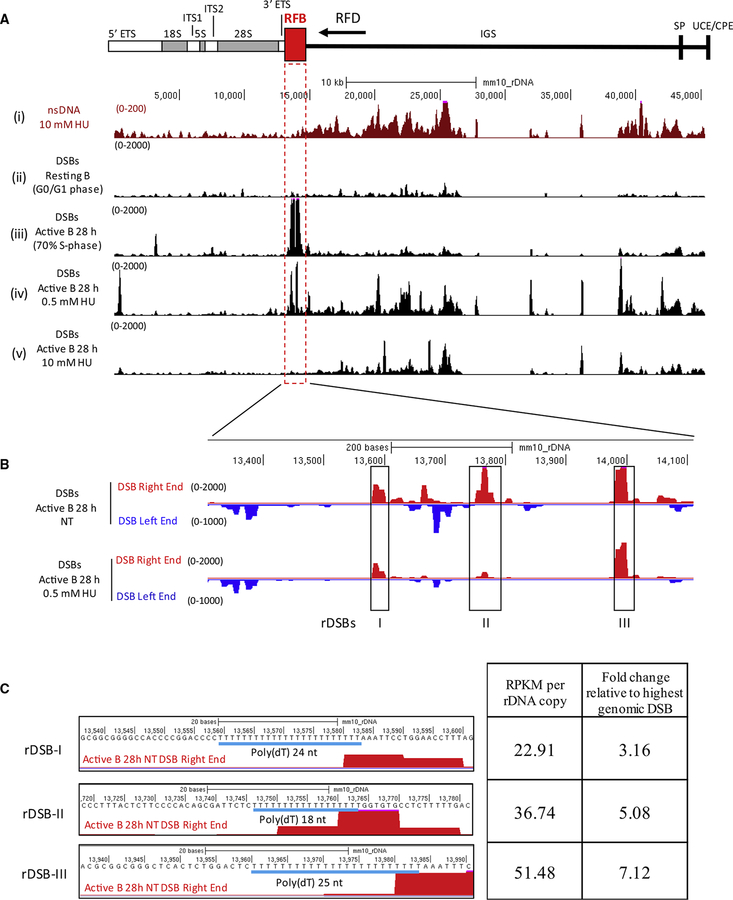
Figure 5. Spontaneous Asymmetric DSBs at the rDNA Replication Fork Barrier.
(A) (Top) Diagram of the rDNA locus. Replication fork barrier (RFB) and predicted replication fork direction (arrow, RFD) are indicated. (Bottom) UCSC genome browser shots for (i) replication initiation (nsDNA), DSBs in (ii) resting B cells, (iii) activated B cells (28 hr), (iv) activated B cells treated with 0.5 mM HU, and (v) activated B cells treated with 10 mM HU.
(B) Genome browser shots of the three spontaneous DSBs at the rDNA RFB, separated by DSB ends.
(C) Left panel: poly(dA:dT) sequences at the spontaneous rDSBs. Right panel: DSB frequency as determined by RPKM, relative to the highest spontaneous genomic DSB (RPKM = 7.2) in activated B cells.

