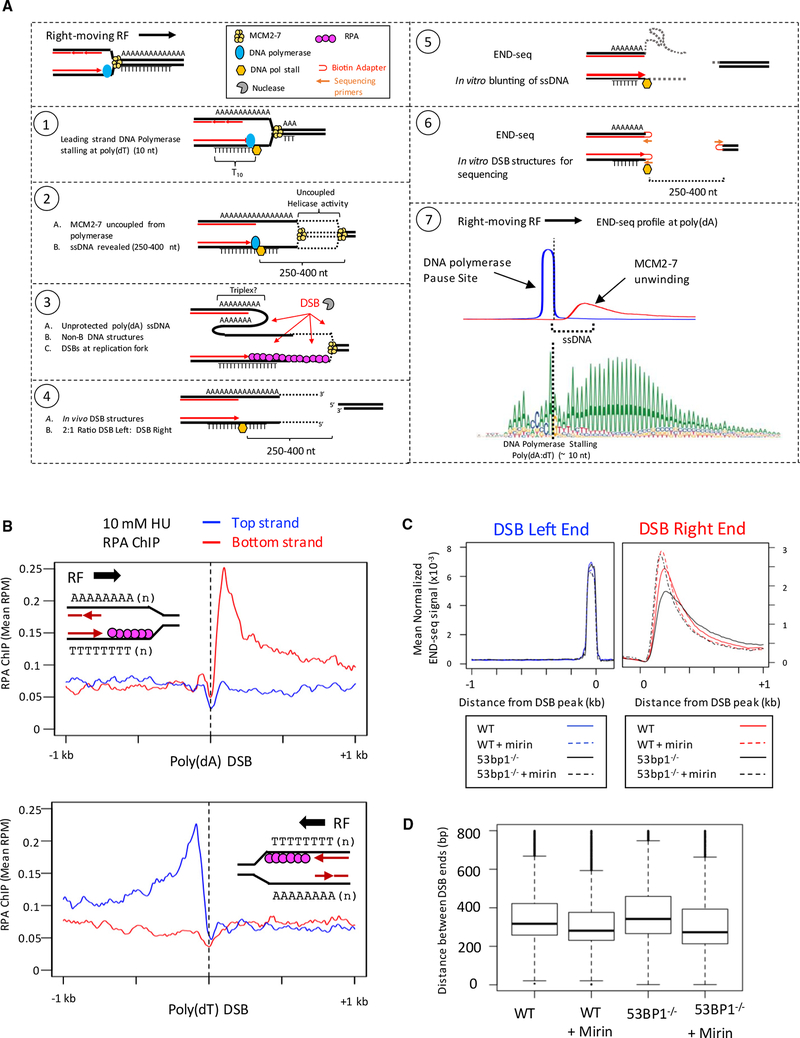
Figure 6. Model for Replication Fork Breakage at Poly(dA:dT) Tracts.
(A) Model for replication fork breakage at poly(dA:dT) and detection of replication fork DSBs by END-seq. END-seq reveals the site of DNA polymerase stalling on one end and the location where MCM2–7 helicase stops ahead of the polymerase on the other end.
(B) ChIP-seq separated by strands at poly(dA) and poly(dT) sequences. (Top panel) Composite plot for RPA ChIP at poly(dA) sites broken in activated B cells treated with 10 mM HU. (Bottom panel) Composite plot for RPA ChIP at poly(dT) sites broken in activated B cells treated with 10 mM HU.
(C) Composite plots showing the distribution of DSB ends at poly(dA) tracts in activated B cells treated with 0.5 mM HU.
(D) Boxplots showing the distance between left and right DSB ends in activated B cells treated with 0.5 mM HU. Distances are divided into quartiles (box), with the line indicating the median. Median distances: wild-type (WT) = 328 bp; WT + mirin = 288 bp; 53BP−/− = 357 bp; 53BP1−/−+ mirin = 287 bp.

