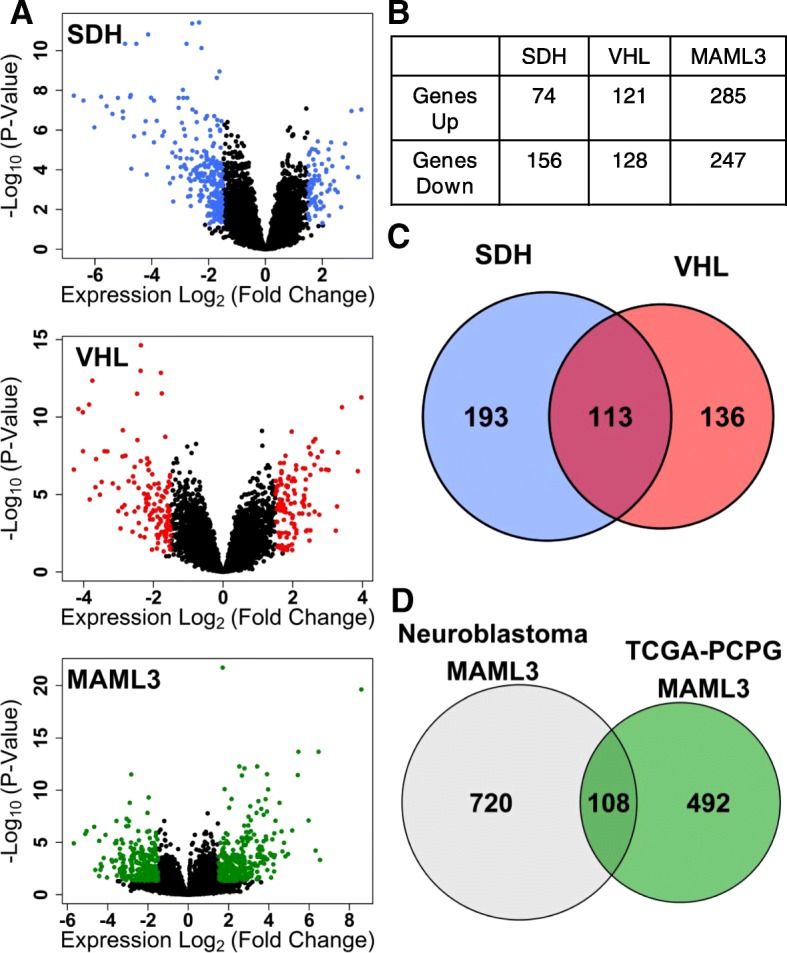
Fig. 1.

PPGL subtype-specific gene expression signatures. a Volcano plots highlighting genes identified in differential expression analysis as having absolute log2-fold change > 1.5 and adjusted p-value < 0.05. Comparisons for SDH-loss and VHL-loss are in reference to normal adrenal medulla. Comparison for MAML3 translocation is in reference to all other PPGL molecular subtypes. b Numbers of differentially-expressed genes detected for each PPGL subtype. c Venn diagram showing overlap of differentially-expressed genes detected in SDH-loss, VHL-loss, and MAML3 transcriptomic signatures. d Venn diagram showing overlap of MAML3 translocation gene expression signatures in PPGL tumors (TCGA-PCPG) and in neuroblastoma tumors
