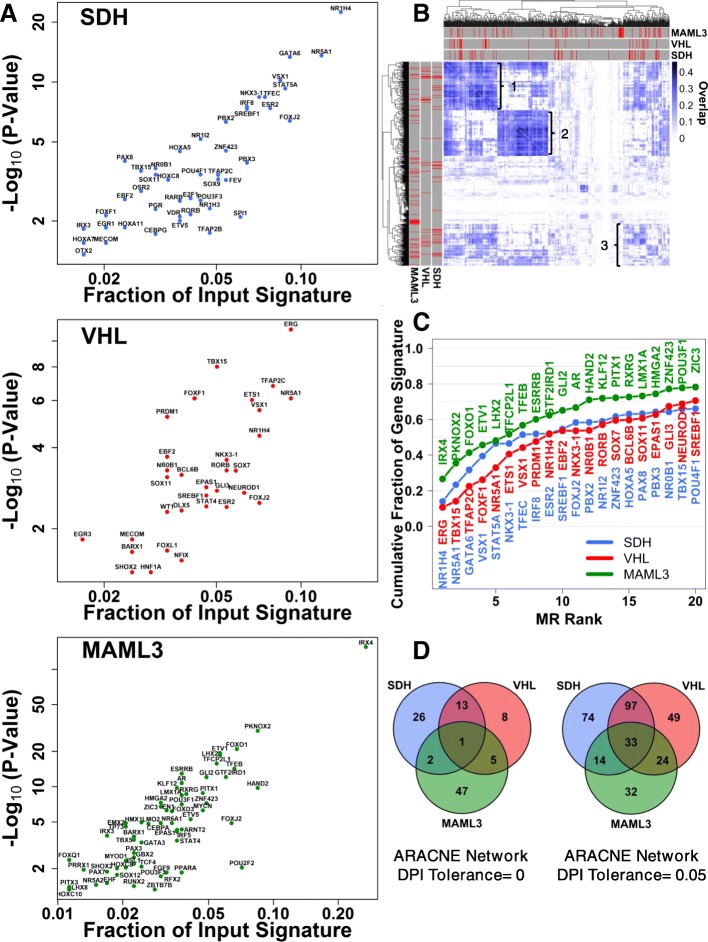
Fig. 2.
MRs of PPGL transcriptomic signatures. a x-y plots showing statistical significance (y-axis) and potential fraction of the input gene expression signature (x-axis) explained by the inferred MRs for each PPGL molecular subtype. b Hierarchical clustering analysis of all TFs sorted according to PPGL tumor regulon overlap. Highly co-regulated transcriptional subnetworks are indicated with numeric values. Annotations in red indicate the identities of putative MRs inferred for each PPGL molecular subtype. c Running cumulative MR-attributable fraction of SDH-loss, VHL-loss, and MAML3 translocation gene expression signatures. MRs are ranked in increasing order of MRA p-value. d Analysis of MR overlap between SDH-loss, VHL-loss, and MAML3 translocation PPGL subtypes for MRA performed on ARACNE inferred transcriptional networks trimmed with DPI tolerance of 0 and 0.05, respectively

