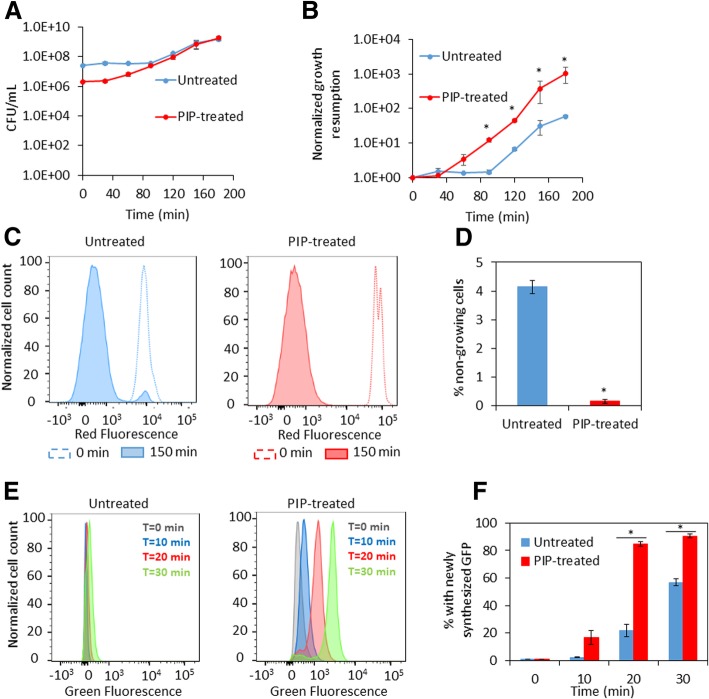
Fig. 3.
Growth resumption of PIP-treated stationary phase cells. Cell cultures were treated with piperacillin (PIP-treated) or water (untreated) at t = 4 h. At t = 24 h, measurements of growth resumption, cell division, and protein synthesis were initiated. a Cells were washed to remove piperacillin and diluted in fresh media. CFU/mL were monitored at the indicated time points. b Normalized growth resumption from A were plotted at the indicated time points. c Cell cultures carrying mCherry expression system were grown in LB with inducer (1 mM IPTG) until t = 24 h. At 24 h, cultures were washed and diluted in fresh LB without inducer. mCherry levels in cells at t = 0 min and t = 150 min were detected with flow cytometry (a representative replicate is shown). d The percentages of non-growing cells were calculated from fractions of mCherry positive cells in entire cell populations at t = 150 min. e Cell cultures carrying pQE-80 L-gfp (without IPTG) were diluted at t = 24 h in fresh LB with inducer (1 mM IPTG) for GFP expression. GFP was monitored at indicated time points with flow cytometry (a representative replicate is shown). f Percentage of cells with newly-synthesized GFP were plotted with respect to time. * p < 0.05 (t-test). Data represent three or more biological replicates. Each data point was denoted as mean ± s.e

