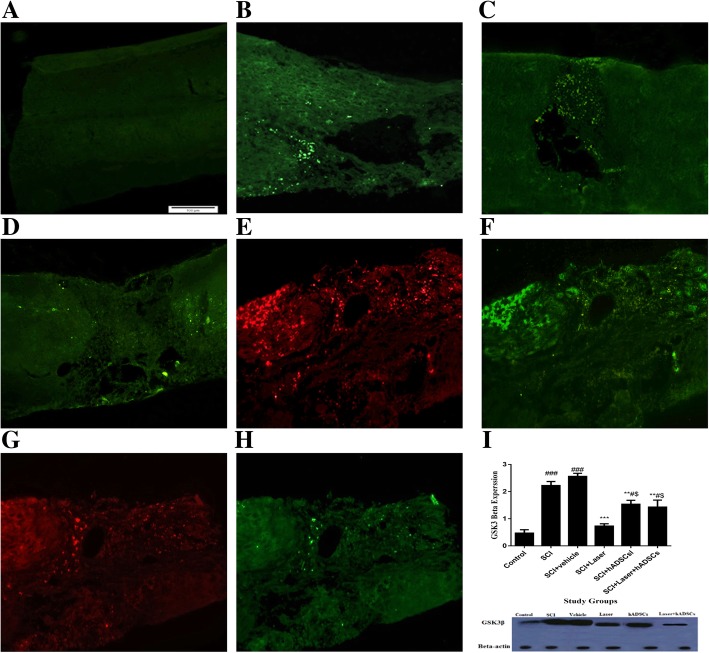
Fig. 3.
Localization (a–h, immunohistochemistry) and quantification (i and j, Western blotting) of glycogen synthase kinase-3β (GSK 3β) expression in experimental groups 4 weeks after spinal cord injury (SCI), the spinal cord longitudinal section (× 20). Control (a); SCI (b); vehicle (c); laser (d); human adipose-derived stem cells (hADSCs; cells labeled by DiI, red) (e); hADSCs (anti-anti GSK 3β conjugated whit FITC, green) (f); laser+hADSCs (red) (g); Laser+hADSCs (green) (h); Western blot of GSK3β expression (i). Data are expressed as mean ± SEM. *p < 0.05, **p < 0.01, ***p < 0.001 versus SCI groups. #p < 0.05, ##p < 0.01, #p < 0.001 versus control group. ††p < 0.01 vs combination group

