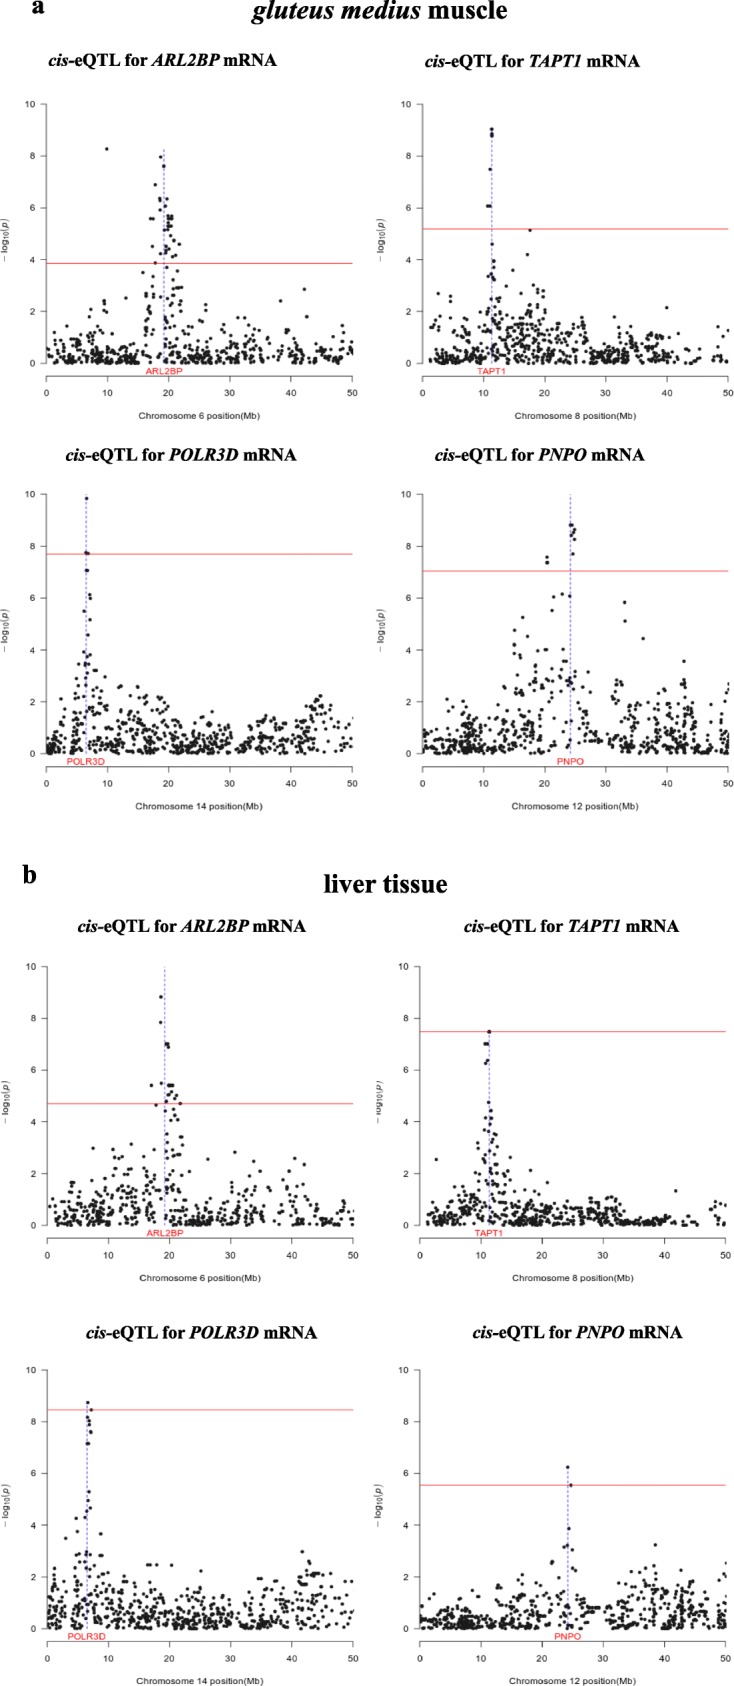
Fig. 2.

Examples of genes that are regulated by the same cis-eQTL in the gluteus medius muscle (a) and liver (b). In the Manhattan plots, the horizontal line indicates the threshold of significance after correction for multiple testing, whilst the vertical line depicts the genomic location of the four genes (ARL2BP, TAPT1, POLR3D and PNPO) under consideration
