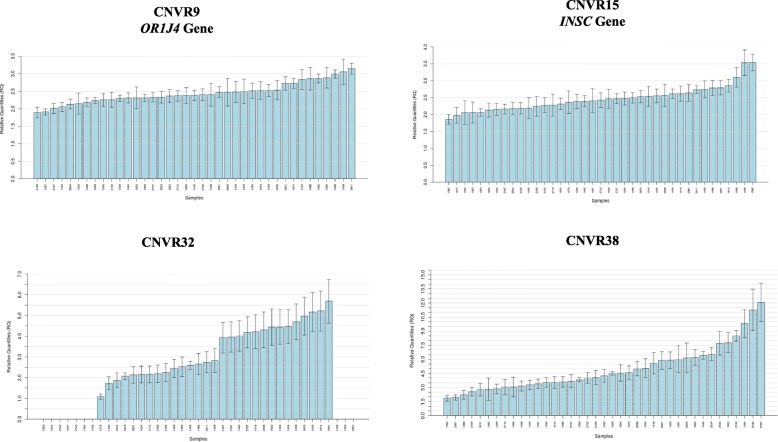
Fig. 5.
Relative expression values of four copy number variation regions validated by quantitative real-time PCR analysis. Each analysed individual is represented in the x-axis, while the y-axis shows the corresponding relative quantification (RQ) value. We have assigned a value of 2 to the arithmetic mean of the samples used as calibrators

