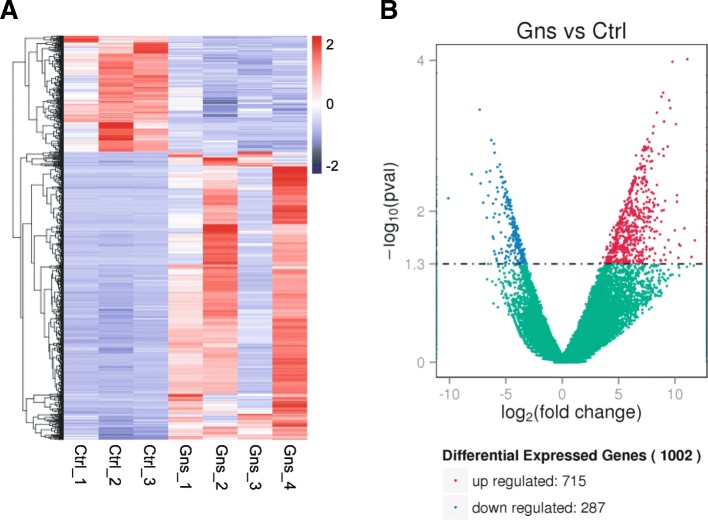
Fig. 1.
Cluster and filter analysis of DEGs. a Heatmap of the differentially expressed genes (DEGs) between Gns and Ctrl group. The color key from blue to red indicates the relative gene expression level from low to high, respectively. b Volcano plot showing DEGs. The x-axis shows the fold-change in gene expression, and the y-axis shows significant statistical differences. Red, up-regulated genes; green, down-regulated genes; blue, genes with no significant difference in expression

