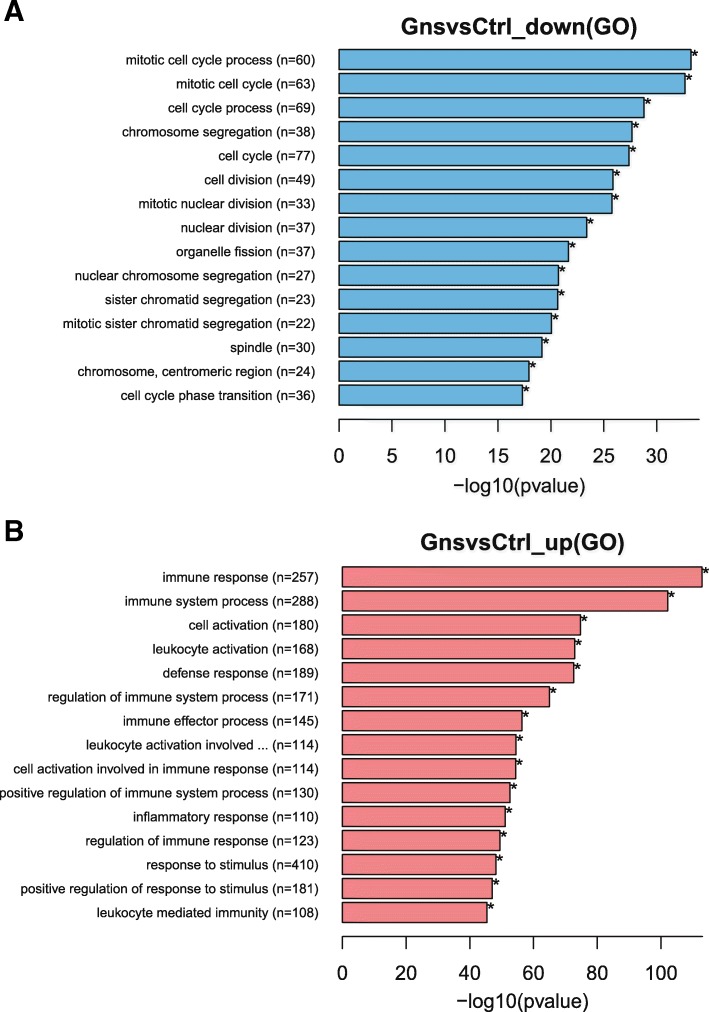
Fig. 2.
GO enrichment in biological process analysis of DEGs. The x-axis shows −log10 (P-value), and the y-axis shows five representative GO biological process terms and the number of genes representing each category (n). a Genes down-regulated in Gns compared with the Control; b Genes up-regulated in Gns compared with the Control

