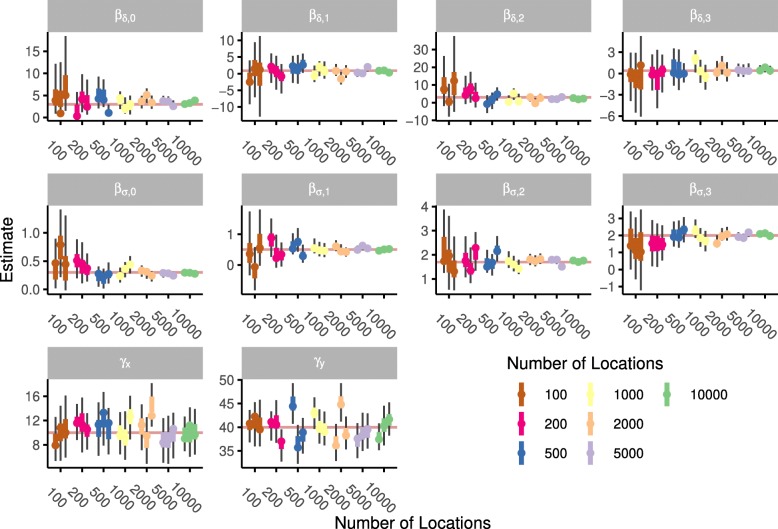
Fig. 1.
Results of fitting the BBCM to simulated trajectories. Each simulation was based on 10 parameters that were estimated using the model. Each panel displays the estimations for one parameter; the set parameter value is shown by the horizontal line. Simulations were conducted for three replicates of seven different trajectory lengths. Vertical lines indicate 50% and 95% confidence intervals from the MCMC simulation; points reflect the maximum likelihood estimate

