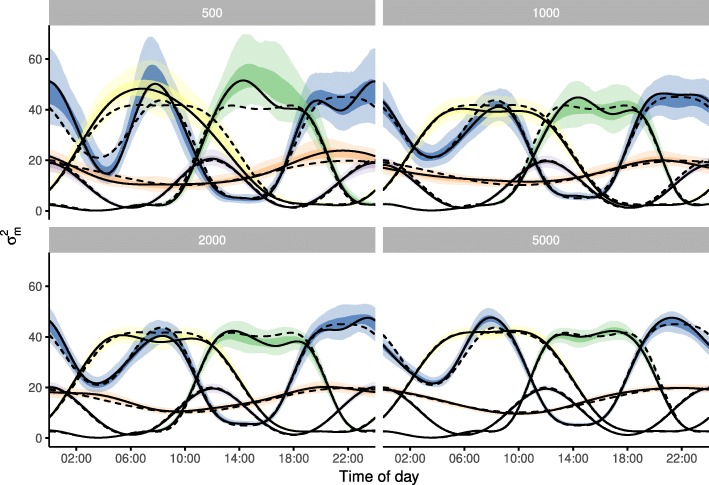
Fig. 2.
Results from fitting daily movement smoothers to test trajectories. I simulated four daily movement patterns; for each pattern four different trajectory lengths have been simulated, this length is indicated in the subpanel header. Each daily movement pattern is shown in a different colour. The model fit to the simulated trajectories is visualized by the maximum likelihood estimate as a solid line with the 50% and 95% confidence intervals shown by the darker and lighter shading, respectively. Dashed lines depict the simulated daily movement patterns

