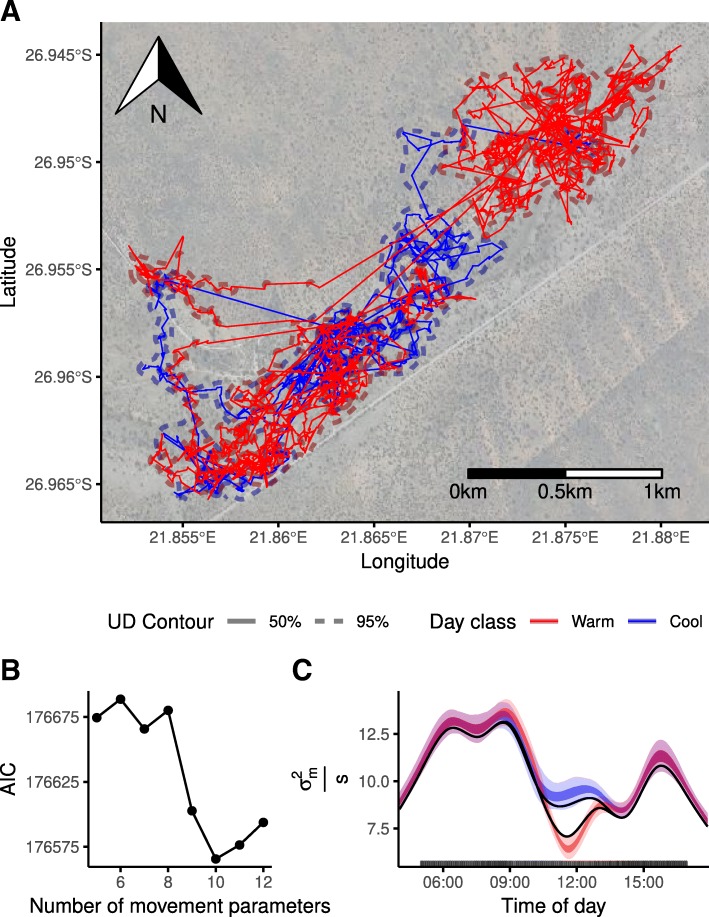
Fig. 3.
Results of fitting the BBCM to a meerkat trajectory. a | The trajectory of the meerkat studied; track colour reflects whether the day was classified as cool or hot. The isolines reflect the 50% and 95% contour of the UD calculated separately for cooler and warmer days. b | The AIC of the various models fitted to the trajectory as a function of the number of knots. AIC drops until ten knots and then increases slightly. c | A plot of the fitted activity pattern that includes the effect of the cooler days. The graph shows the maximum likelihood estimate (black line) and 50% and 95% confidence intervals by the darker and lighter shade, respectively

