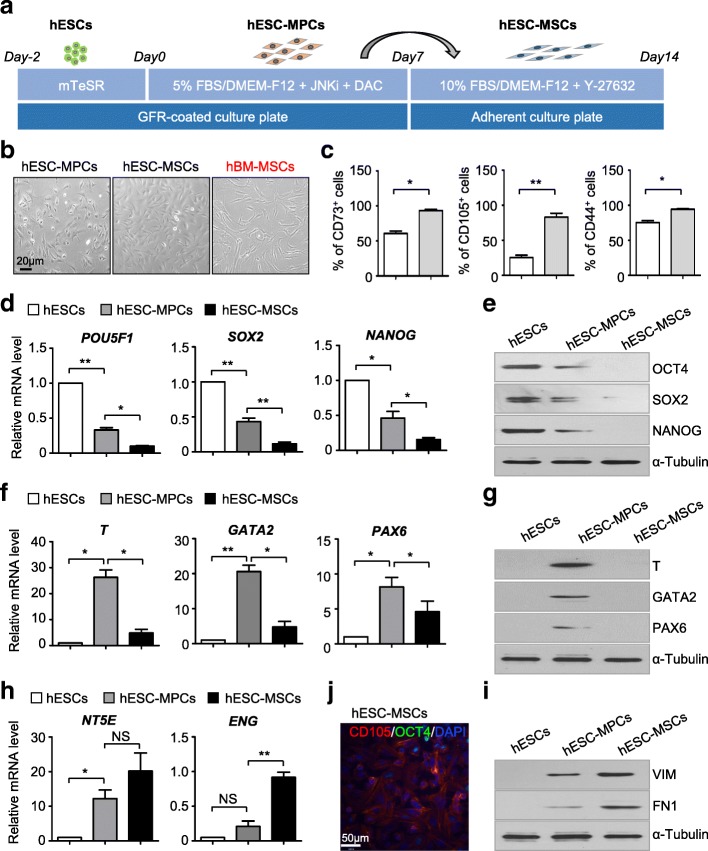
Fig. 2.
High-efficiency generation of homogeneous hESC-MSCs. a Schematic of mesenchymal differentiation from hESCs to hESC-MSCs. Briefly, single H1 hESCs were seeded on GFR-coated 6-well plate for 2 days, then the mTeSR medium was changed into DMEF/F12 media supplied with 5% FBS, JNKi, and DAC for a week. To generate more mature MSCs (hESC-MSCs), hESC-MPCs were passaged onto adherent culture plate, and the medium was changed into DMEF/F12 media supplied with 10% FBS and 10 nM Y-27632 for another week. b Morphology of derived hESC-MSCs and hBM-MSCs (scale bar = 20 μm). c Flow cytometry (FCM) analysis showing the percentage of CD73+, CD105+, and CD44+ cells in hESC-MPCs and hESC-MSCs. Data are shown as mean ± SEM (n = 3). *P < 0.05; **P < 0.01; NS, not significant. d qRT-PCR analysis of pluripotency markers (POU5F1, SOX2, NANOG) in undifferentiated hESCs, hESC-MPCs, and hESC-MSCs. Data are shown as mean ± SEM (n = 3). *P < 0.05; **P < 0.01. e Western blotting analysis of pluripotency markers (OCT4, SOX2, NANOG) in undifferentiated hESCs, hESC-MPCs, and hESC-MSCs. α-Tubulin was used as a loading control. f qRT-PCR analysis of germ layer-associated genes (T, GATA2, PAX6) in undifferentiated hESCs, hESC-MPCs, and hESC-MSCs. Data are shown as mean ± SEM (n = 3). *P < 0.05; **P < 0.01; NS, not significant. g Western blotting analysis of germ layer-associated genes (T, GATA2, PAX6) in undifferentiated hESCs, hESC-MPCs, and hESC-MSCs. α-Tubulin was used as a loading control. h qRT-PCR analysis of MSC-associated genes (NT5E, ENG) in undifferentiated hESCs, hESC-MPCs, and hESC-MSCs. Data are shown as mean ± SEM (n = 3). *P < 0.05; **P < 0.01; NS, not significant. All values are normalized to the hESC group (= 1). i Western blotting analysis of MSC-associated genes (VIM. FN1) in undifferentiated hESCs, hESC-MPCs, and hESC-MSCs. α-Tubulin was used as a loading control. j The representative immunofluorescence image displays the expression of OCT4 (in green) and CD105 (in red) in hESCs (scale bar = 50 μm). The nuclei (in blue) were labeled with DAPI

