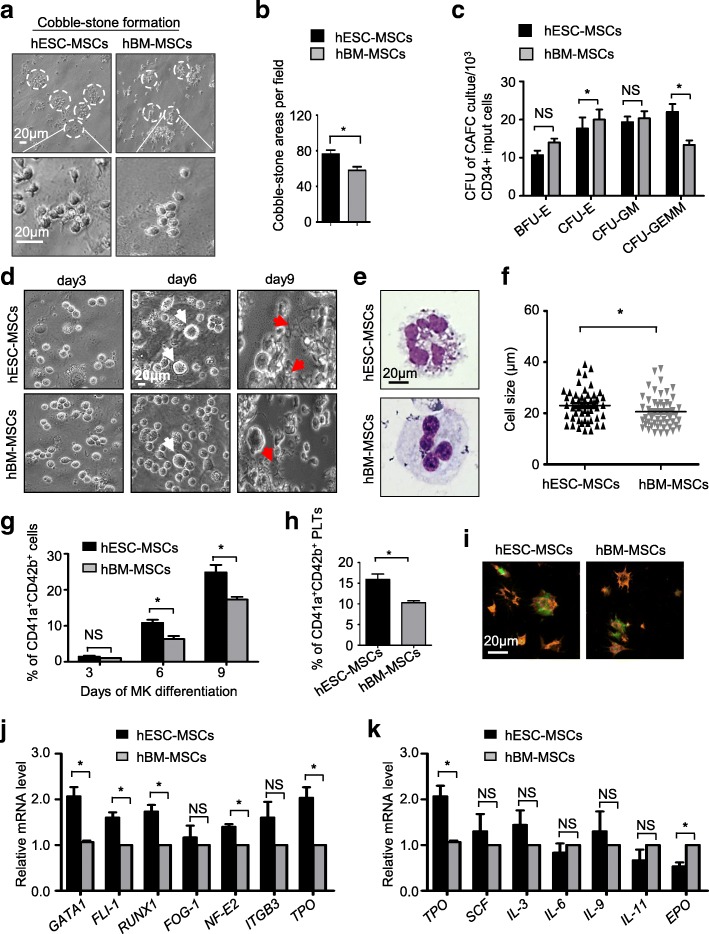
Fig. 4.
The hESC-MSCs show comparable hematologic-supporting potential as hBM-MSCs in vitro. a Phase contrast images of cobblestone areas formed by UCB-CD34+ cells co-cultured with hESC-MSCs or hBM-MSCs in DMEM/F-12 media containing 10% FBS and 10% horse serum for 2 weeks. Scale bar = 20 μm. b Statistical analysis of cobblestone areas per field between the hESC-MSC and hBM-MSC groups. Data are shown as mean ± SEM (N = 3). c Statistical analysis of colony-forming units (BFU-E, CFU-E, CFU-GM, CFU-GEMM) by UCB-CD34+ cell-derived cobblestone area-forming cells (CAFCs). Data are shown as mean ± SEM (n = 3). *P < 0.05; NS, not significant. d Representative cell morphology at day 3, day 6, or day 9 of megakaryocytic differentiation from UCB-CD34+ cells co-cultured with hESC-MSCs or hBM-MSCs in megakaryocytic differentiation media. Scale bar = 20 μm. Large cells are pointed by white arrows, and proplatelets are pointed by red arrows. e Representative megakaryocyte derived from UCB-CD34+ cells co-cultured with hESC-MSCs or hBM-MSCs at day 9, identified by Wright’s Giemsa staining. Scale bar = 20 μm. f Distribution of sizes of megakaryocytes at day 6 in d as measured with microscopy. Data are shown as mean ± SEM (n = 50). *P < 0.05. g Flow cytometry (FCM) analysis for the percentage of CD41a+CD42b+ megakaryocytes in the hESC-MSC and hBM-MSC groups at day 3, day 6, or day 9 of megakaryocytic differentiation, respectively. Data are shown as mean ± SEM (n = 3). *P < 0.05. h Flow cytometry (FCM) analysis for the percentage of CD41a+CD42b+ platelets in the hESC-MSC and hBM-MSC groups at day 9 of megakaryocytic differentiation. Data are shown as mean ± SEM (n = 3). *P < 0.05. i Aggregates of a mixture of Calcium-AM (red)-labeled blood or cultured platelets and blood platelets. In red, β-tubulin staining of both populations. Scale bar = 20 μm. j qRT-PCR analysis of the hematopoietic or megakaryocytic markers (GATA1, FLI-1, RUNX1, FOG-1, NF-E2, ITGB3, TPO) in CD34+ HSC-derived cells co-cultured with hESC-MSCs and hBM-MSCs at day 9. Data are shown as mean ± SEM (n = 3). *P < 0.05; NS, not significant. All values are normalized to the hBM-MSC group (= 1). k qRT-PCR analysis of the cytokines associated with hematopoietic or megakaryocytic differentiation (TPO, SCF, IL-3, IL-6, IL-9, IL-11, EPO) in hESC-MSCs and hBM-MSCs. Data are shown as mean ± SEM (n = 3). *P < 0.05; NS, not significant. All values are normalized to the hBM-MSC group (= 1)

