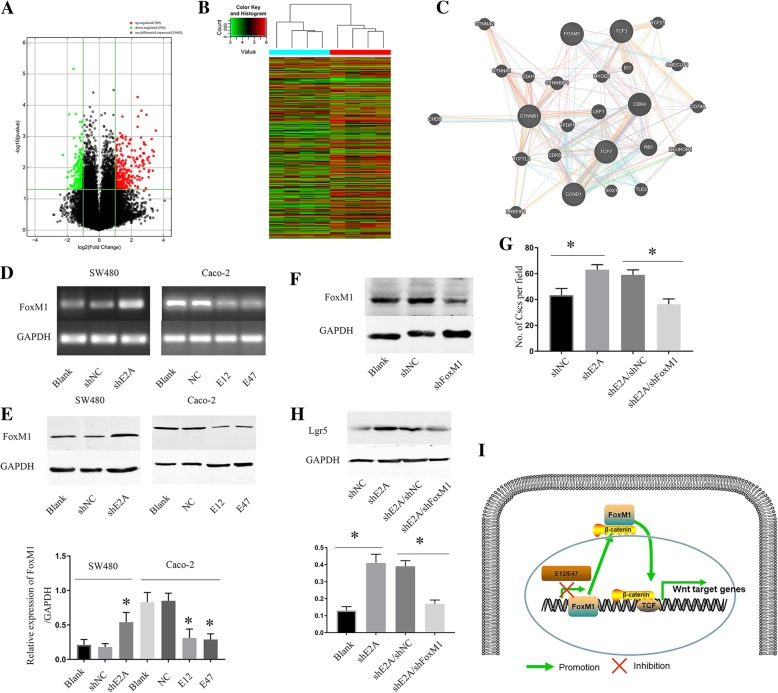
Fig. 5.
Foxm1 is a downstream target through which E2A suppressed CRC cell tumor-initiating capacity. a, b Heat map and volcano plot displaying the hierarchical clustering of the mRNA expression profiles. c PPI protein network generated by Genemania showing the relationship between E2A, FoxM1 and β-catenin. d Downregulation of E2A by shE2A resulted in increased FoxM1 mRNA expression in SW480 cells, whereas transfection of plasmids encoding E12 or E47 decreased FoxM1 mRNA in Caco-2 cells, as revealed by semi-qRT-PCR. e E2A decreased FoxM1 protein expression, as determined by immunoblot analysis. Lower panel: Densitometric analysis of FoxM1 normalized to GAPDH. Data in the histograms is expressed as the mean ± SD from three separate experiments. f Immunoblot analysis of FoxM1, with GAPDH as loading control. g shFoxM1 decreased tumor-initiating ability of SW480/shE2A cells to a level like that of SW480/shE2A cells. h Lgr5 expression in SW480/shE2A cells treated with shFoxM1 is like that in SW480/shNC, which is lower than in SW480/shE2A. Lower panel: Densitometric analysis of Lgr5 normalized to GAPDH. Data in the histograms is expressed as mean ± SD from three separate experiments. i Schematic diagram illustrates that E2A inhibited FoxM1 transcription to attenuate FoxM1, depending on β-catenin translocation to cell nuclei, which decreased the Wnt pathway in CRC cells

