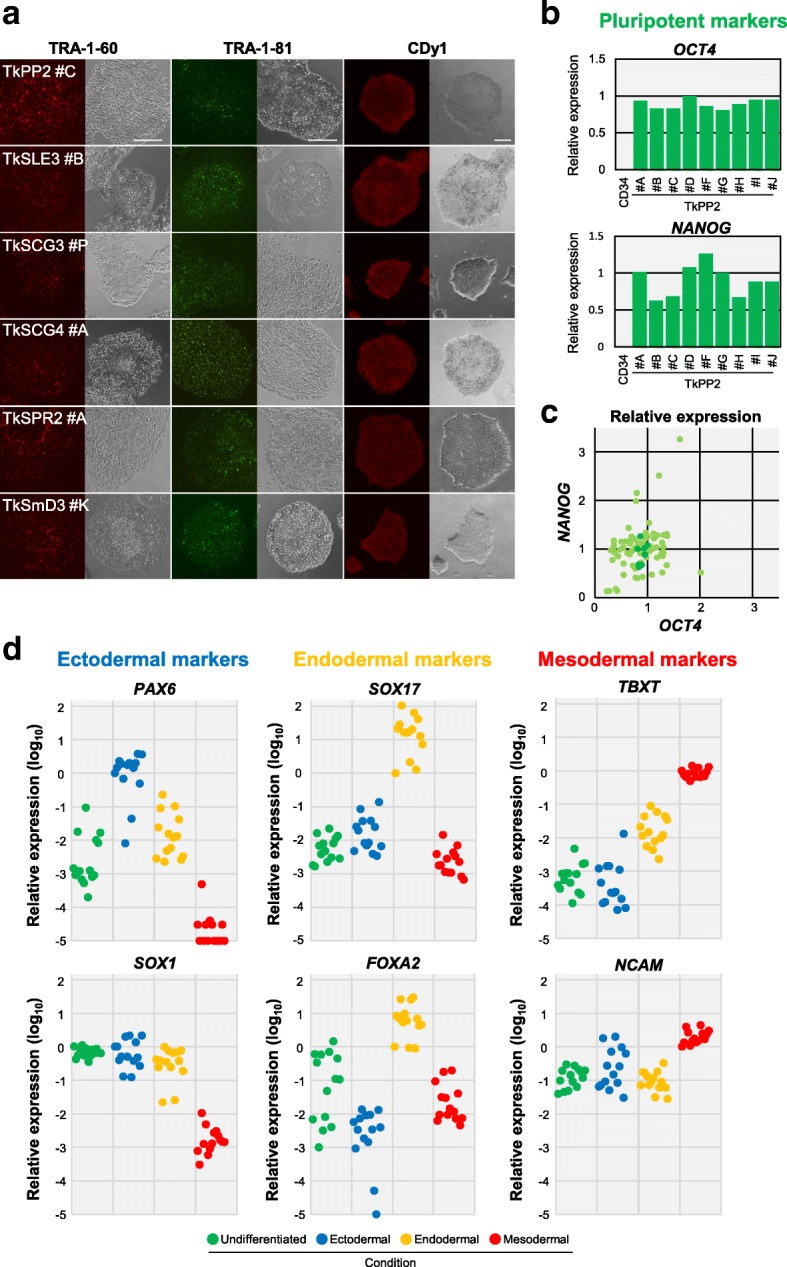
Fig. 5.

Pluripotency marker expression and trilineage differentiation capability confirmed in the established human induced pluripotent stem cell (hiPSC) lines. a Fluorescent images of live colonies stained with anti-TRA-1-60 antibody (red, left), anti-TRA-1-81 antibody (green, middle), or the CDy1 dye (red, right). Phase-contrast images are also shown in a side-by-side fashion for each picture. Scale bars indicate 200 μm. b Graph demonstrating the quantification results of OCT4 and NANOG transcripts in the TkPP2 lines, assessed by RT-qPCR analysis. The relative expression values for each gene, normalized to the level observed in the standard TkDA3-4 hiPSC sample, are shown. CD34+-enriched cells derived from the TkPP2 donor sample were used as the negative control (CD34). c Scatter plot showing a comprehensive representation of the relative expression values of OCT4 and NANOG in the 85 hiPSC lines examined. The results of 76 patient-derived hiPSCs are shown as light green plots. The results of 9 TkPP2 lines (same data in b) are shown in dark green for comparison. d Graphs showing the relative expression values of each marker gene calculated by the ΔΔCt method with CFX™ Manager software. The plots (14 hiPSC lines) are colored according to the culture condition shown at the bottom. “Undifferentiated” (green) represents hiPSC samples cultured in a pluripotent state. The other samples were cells cultured under differentiation conditions, with each being directed for the corresponding lineage (ectodermal, endodermal, or mesodermal)
