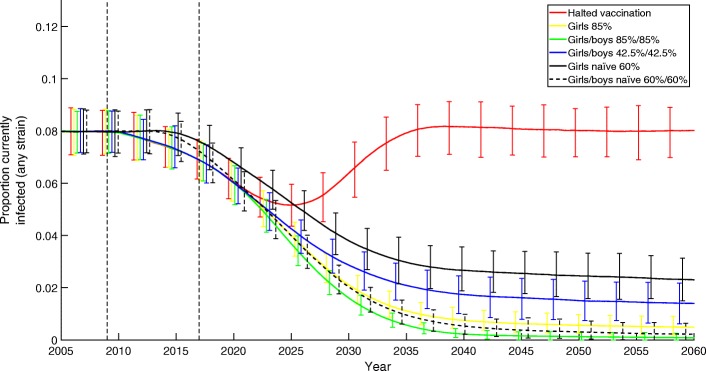
Fig. 1.
The effects of different vaccination strategies on the prevalence of HPV in the population, over the 30 years following a change in strategy. Strategies tested include: halted vaccination (red), girls only at 85% (yellow), girls/boys at 85%/85% (green), girls/boys at 42.5%/42.5% (blue), girls at 60% from 2008 (black solid), and girls/boys at 60%/60% from 2008 (black dashed). All strategies use the nonavalent vaccine

