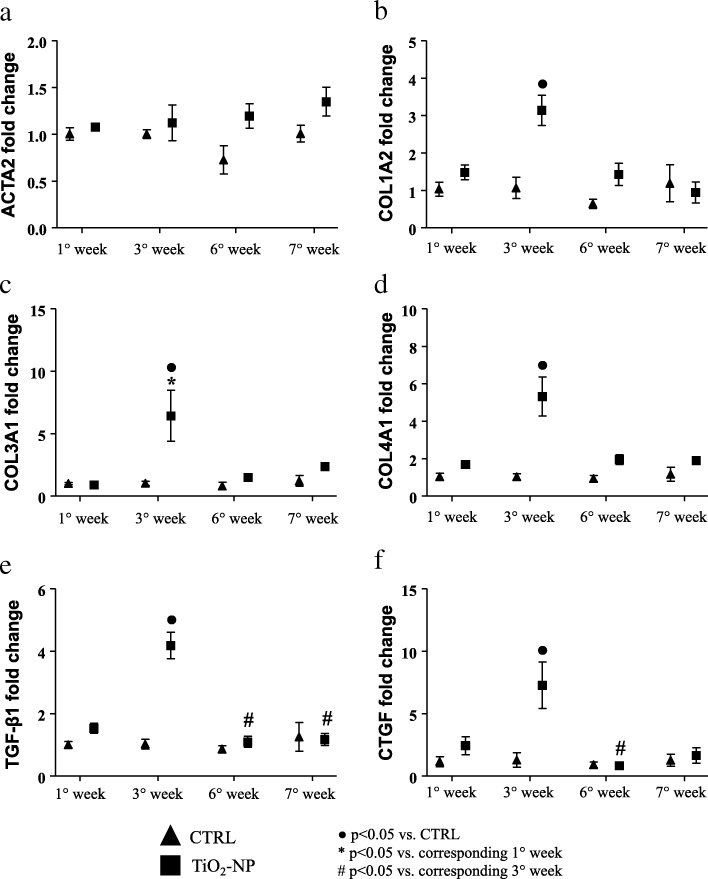
Fig. 9.
Molecular analysis displaying different gene expression linked to fibrosis deposition. Graph of different gene expression in CRTL (triangles) and TiO2-NPs treated (square) animals. a ACTA2 gene expression; b COL1A2 gene expression; c COL3A1 gene expression; d COL4A1 gene expression; e TGF-β1 gene expression; f CTGF gene expression. Kruskal-Wallis (post hoc analyses: Dunn’s multiple comparison) was performed and statistical significance was set at p < 0.05. ● vs CTRL; * vs corresponding 1° week; # vs corresponding 3° week. Data are represented as median and IQR

