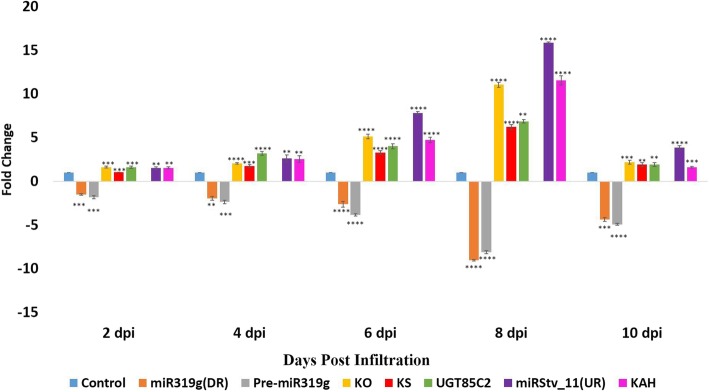
Fig. 4.
Real-Time PCR analysis of miR319g, miRStv_11 and their target genes when leaves were transformed with miR319g down-regulation and miRStv_11 over-expression constructs. Expression was normalised to that of actin. miRNAs and their target gene levels from the wild type were set as the control. Error bars indicate ±SE (n = 3), (*) indicates significance of variance (1*-0.05; 2*-0.01; 3*-0.001; 4*-0.0001). *UR: Up-regulation. *DR: Down-regulation

