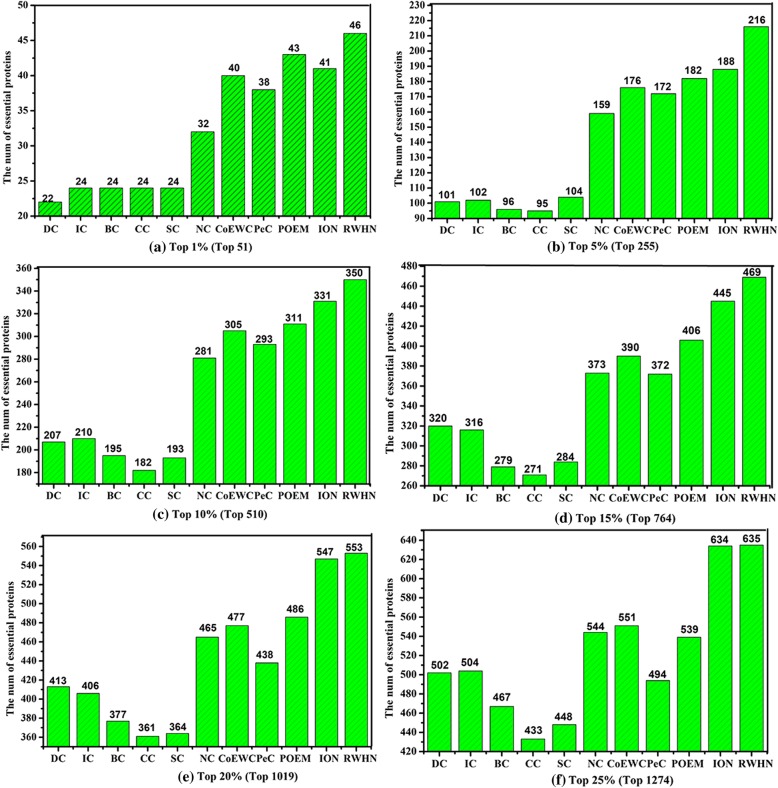
Fig. 2.
a Top 1% ranked proteins. b Top 5% ranked proteins. c Top 10% ranked proteins. d Top 15% ranked proteins. e Top 20% ranked proteins. f Top 25% ranked proteins. Comparison of the number of essential proteins predicted by RWHN and ten other competitive methods. The proteins in PPI network are ranked in the descending order based on their ranking scores computed by RWHN, Degree Centrality (DC), Information Centrality (IC), Closeness Centrality (CC), Betweenness Centrality (BC), Subgraph Centrality (SC), Neighbor Centrality (NC), PeC, CoEWC, POEM and ION. Then, top 1, 5, 10, 15, 20 and 25% of the ranked proteins are selected as candidates for essential proteins. According to the list of known essential proteins, the number of true essential proteins is used to judge the performance of each method. The figure shows the number of true essential proteins identified by each method in each top percentage of ranked proteins. Since the total number of ranked proteins is 5093. The digits in brackets denote the number of proteins ranked in each top percentage

