
Fig. 7.
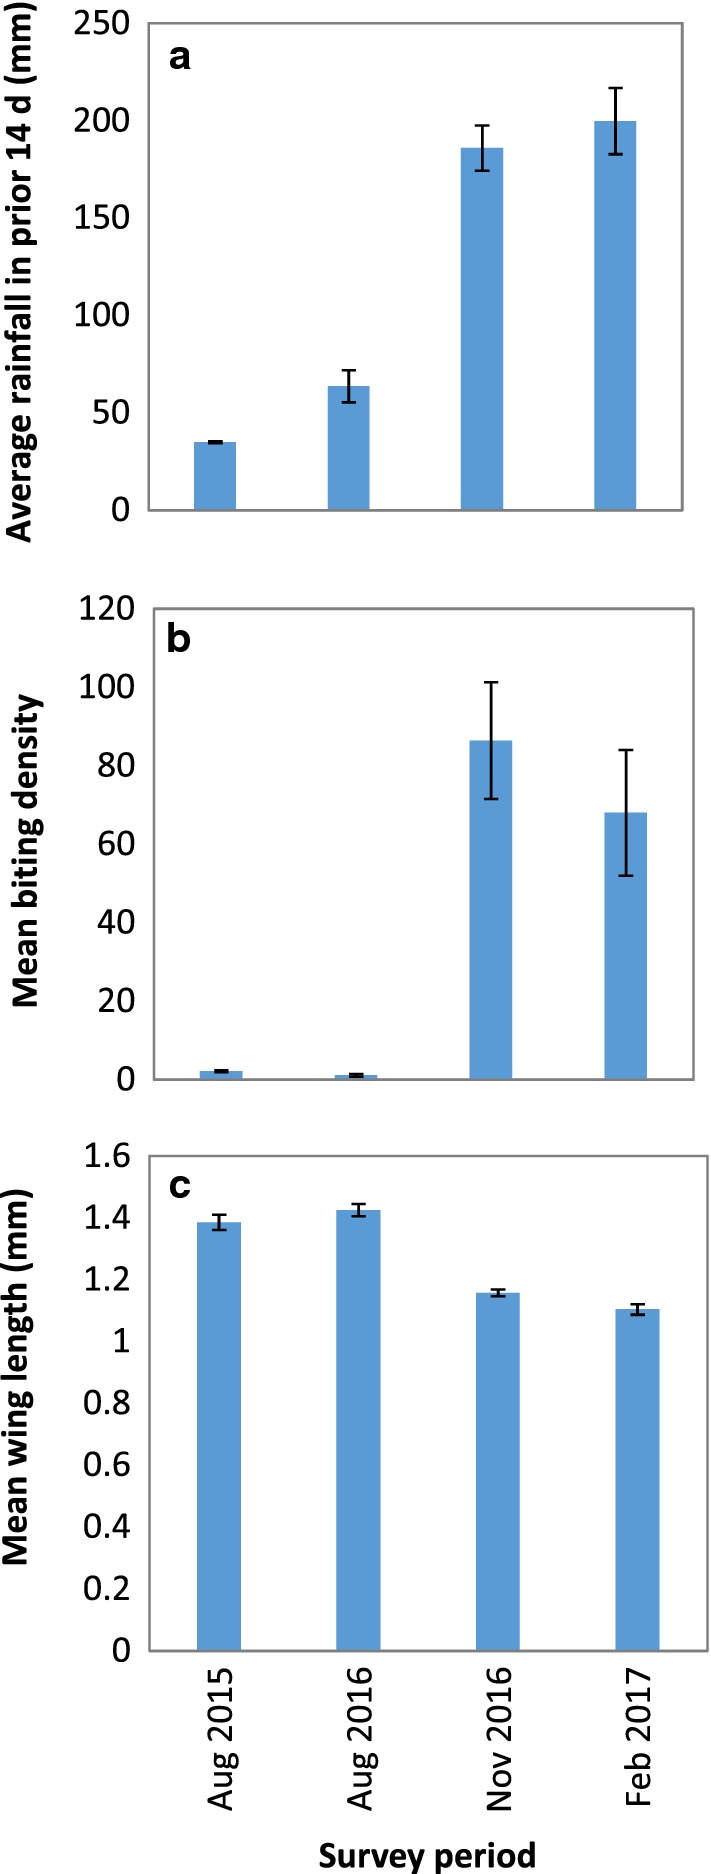
Comparison of independent sample periods in Jack Harbour with a rainfall, b Anopheles farauti densities and c mean wing lengths for. Each bar represents the average value (± se)
Official websites use .gov
A
.gov website belongs to an official
government organization in the United States.
Secure .gov websites use HTTPS
A lock (
) or https:// means you've safely
connected to the .gov website. Share sensitive
information only on official, secure websites.
Comparison of independent sample periods in Jack Harbour with a rainfall, b Anopheles farauti densities and c mean wing lengths for. Each bar represents the average value (± se)