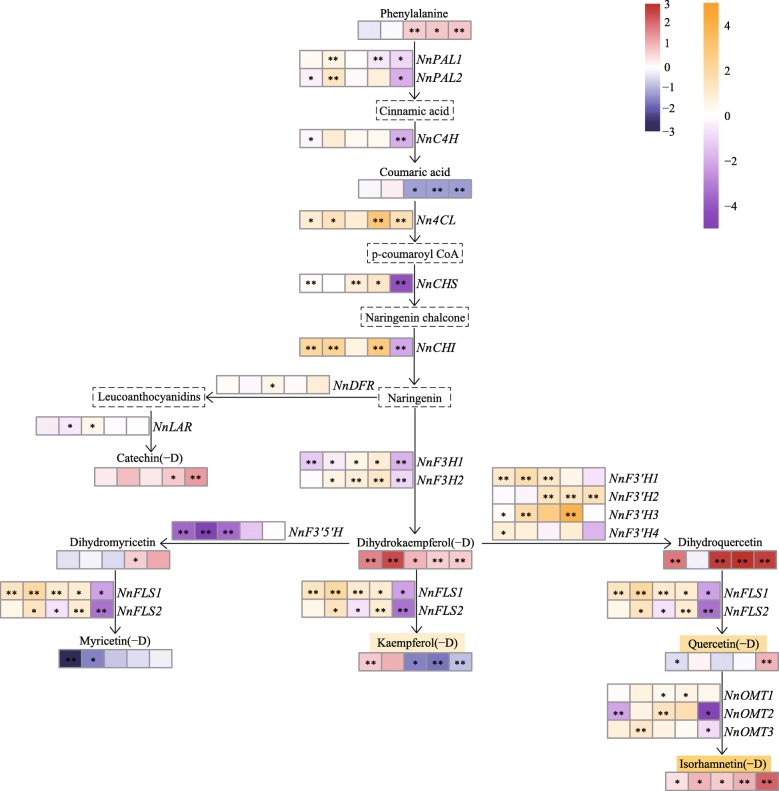
Fig. 10.
Schematic flow chat of the flavonoid pathway of lotus. Red and blue shades indicate up and down regulated metabolites, orange and purple indicate up-regulated and down- regulated genes, in MLQS compared to YGB at five stages (S1: left1 cell, S2: left2 cell, S3: central cell, S4: right2 cell, S1: right1cell). Box with a dotted line represents the undetected metabolite

