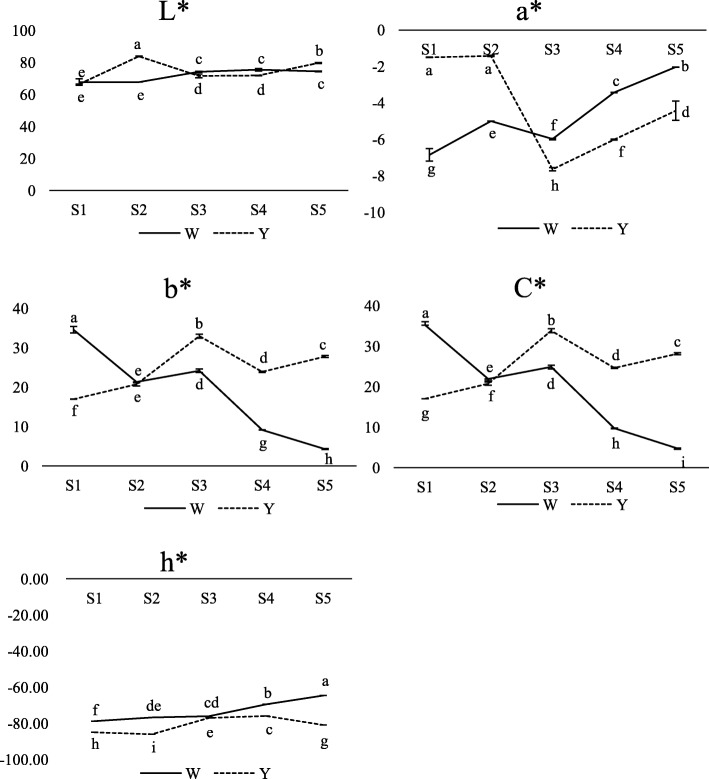
Fig. 2.
Changes of flower color parameters (L*, a*, b* and C*) of MLQS and YGB at five flower colouration stages. The y-axis scales the mean value of three biological repeats. Lower case letters show significant differences (P < 0.05) of the color parameter among stages based on ANOVA and Duncan’s multiple range test

