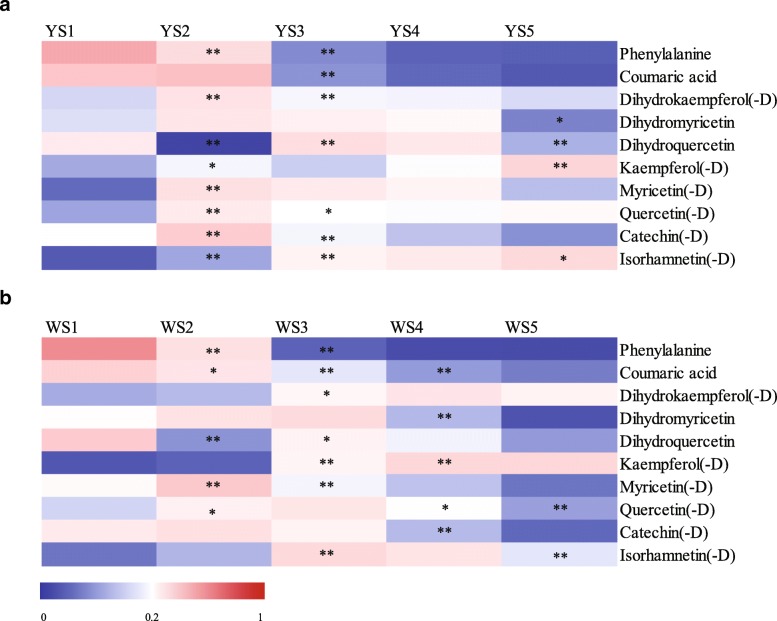
Fig. 5.
Heatmap showing dynamic changes of the 10 secondary metabolites and their derivatives in a MLQS and b YGB during flower colouration. The proportion of each secondary metabolites and their derivatives in all periods from minimal to maximum are colored from blue to red. * indicate significant differences (P < 0.05) with ** indicate highly significant differences (P < 0.01) between MLQS and YGB

